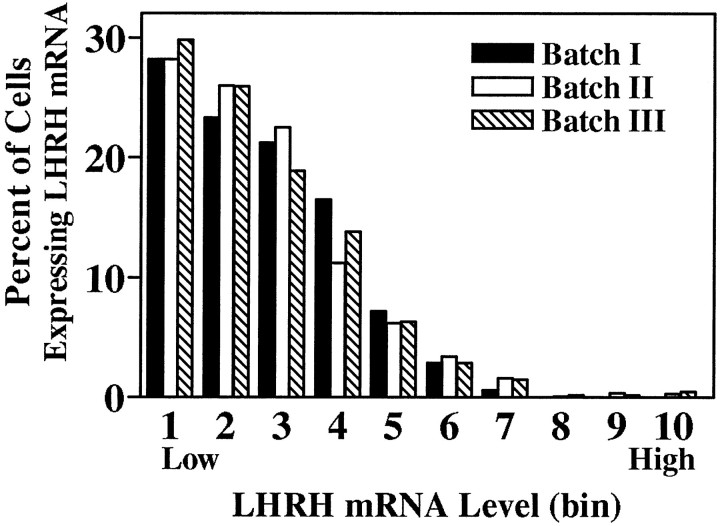
Fig. 3.
Frequency distributions of hybridization signal intensities (LHRH mRNA level per cell) of individual labeled cells from batches I, II, and III control cultures hybridized with a probe against LHRH mRNA. Because slice explant cultures were generated on different dates and processed for ISHH separately (batches I,II, and III), mRNA levels per cell from batches II and III were normalized to those of batch I by multiplying values in batches II and III by the ratio of control mean batch I/control mean batches II or III (ratios = 2.22 and 0.52, respectively). The total range of LHRH mRNA level per cell values was divided into 10 bins with each bin representing, arbitrarily, 9007 O.D. units; bin 1 contains cells with the lowest levels of LHRH mRNA, whereas bin 10 contains those with the highest levels. The frequency distribution of LHRH mRNA levels of single cells in control cultures from each batch was not significantly different from that of the others (p > 0.05, Kolmogorov–Smirnov).

