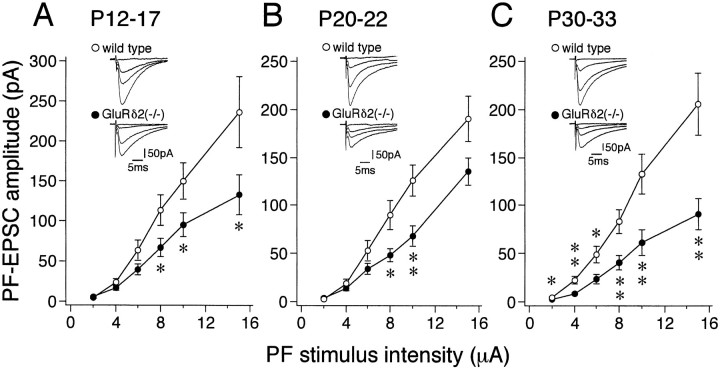
Fig. 8.
Reduced electrophysiological responses to PF stimulation in GluRδ2 mutant PCs. Amplitudes of PF-EPSCs are plotted as a function of stimulus intensity in the wild-type (open circles) and GluRδ2 mutant (filled circles) PCs sampled from mice at P14–P17 (A;n = 10–12 for the wild-type, andn = 18–24 for the GluRδ2 mutant mice), P21–P22 (B; n = 18–20 for the wild-type, and n = 9–13 for the GluRδ2 mutant mice), and P30–P33 (C; n = 20–25 for the wild-type, and n = 19–27 for the GluRδ2 mutant mice). Each point represents the mean ± SEM.Asterisks indicate significant differences between the wild-type and GluRδ2 mutant mice (*p < 0.05; **p < 0.01, t test).Insets, Representative traces of PF-EPSCs with increasing stimulus intensities of 2, 6, 10, and 15 μA.

