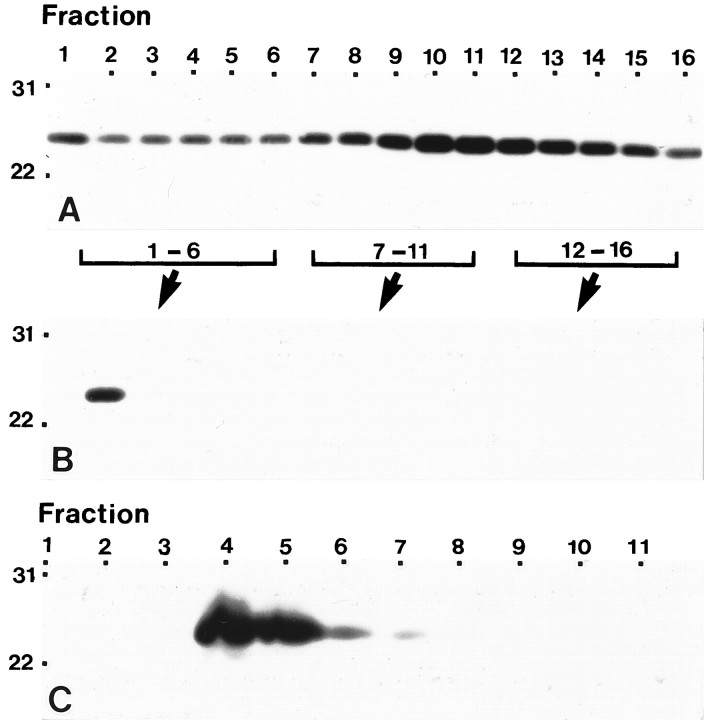
Fig. 6.
Isolation of a caveolin-enriched fraction from type 1 astrocytes in the absence of detergent. A, B, Plasma membranes were purified from type 1 astrocytes on a Percoll gradient, sonicated, and loaded at the bottom of an Optiprep gradient as described in Materials and Methods. One-milliliter fractions were collected across the gradient, and fractions 1–6, 7–11, and 12–16 were pooled and subjected to a second Optiprep gradient. Equal volumes of gradient fractions collected across the first linear Optiprep gradient (A) and the second discontinuous Optiprep gradient (B) were separated by SDS-PAGE and processed for immunoblot analyses using anti-caveolin polyclonal antibody. Caveolin was detected in all fractions distributed across the first Optiprep gradient (A). In contrast, all of the caveolin was detected in a single gradient fraction in the second Optiprep gradient (B). C, Type 1 astrocytes were subjected to subcellular fractionation after homogenization in a buffer containing sodium carbonate as described in Materials and Methods. One-milliliter fractions were collected across the gradient, and equal volumes were separated by SDS-PAGE and processed for immunoblot analyses using anti-caveolin polyclonal antibody. A peak of caveolin immunoreactivity is detected in fractions 4 and 5, which corresponds to the position in the gradient where the opaque band was visualized. In all cases, fraction 1 represents the top of the gradient. Molecular mass × 10−3 is indicated vertically; fraction number is indicatedhorizontally.

