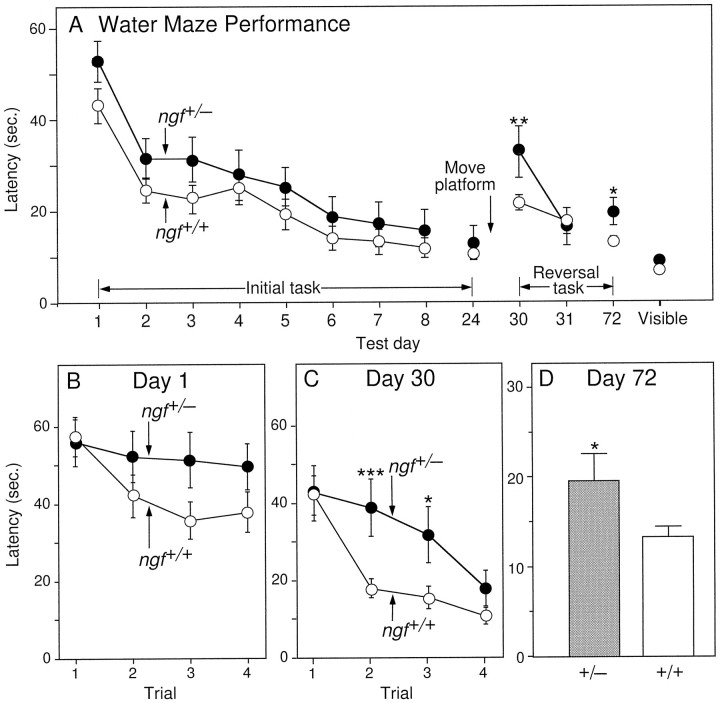
Fig. 1.
A, Mean latency to find the hidden platform on the water maze task on each day of testing. Eachpoint represents the mean performance of a group of mice on the four trials per day. Days 1–8 = performance during the acquisition of the initial location of the hidden platform; day 24 = performance on testing for retention of the initial platform location after a 16 d delay; days30 and 31 = performance during the acquisition of a new platform location; day72 = performance on testing for retention of the new platform location after a 6 week delay. The pointlabeled Visible represents performance on the visible platform task. B, Mean latency to find the hidden platform on each of the individual four trials on Day 1, and (C) on Day 30.D, Mean latency to find the hidden platform on the first trial of Day 72 (*p < 0.05, **p < 0.01, *** p < 0.0005; one-factor ANOVA with post hoc Fisher PLSD).

