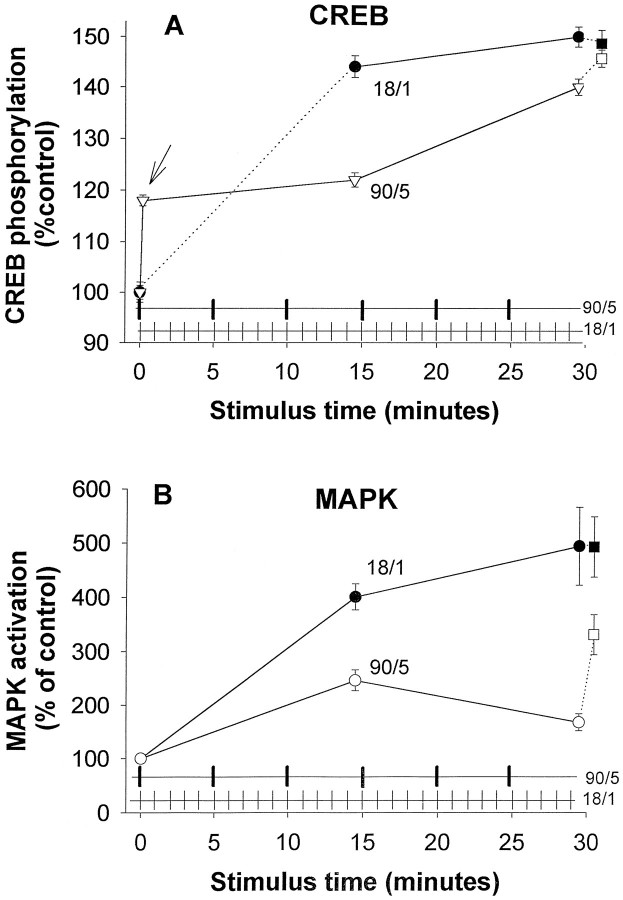
Fig. 10.
Time course of increase in CREB phosphorylation and MAPK activation in response to action potential bursts of 1.8 sec duration (10 Hz) repeated at 1 min intervals (18/1;filled symbols) and 9.0 sec duration repeated at 5 min intervals (90/5; open symbols) for 30 min. Neurons were analyzed just before the stimulus burst to estimate the residual increase in activation (t = 14.5 and 29.5 min) and compared with unstimulated controls (t = 0). A, Levels of CREB activation increase to near-maximal values in <14.5 min of stimulation with either stimulus pattern (18/1 = filled circles;90/5 = open triangles).B, A similar increase in MAPK activation with stimulus time is seen in response to stimulus bursts repeated at 1 min intervals (18/1 = filled circles). A single burst of stimulation at the end of the 30 min period of stimulation with these pulse patterns produces no further increase in CREB or MAPK activation (squares). A significant increase in P-CREB is produced from a single 10 sec burst of action potentials (arrow). A 9 sec burst increases MAPK activation significantly (open square; p < 0.05). Activation of MAPK was not sustained over 5 min interburst intervals, as shown by the failure to summate during the 30 min stimulus period (open circles; differences not significant comparing 0, 14, and 29.5 min). n = 1306 neurons in A and 42 cultures inB.

