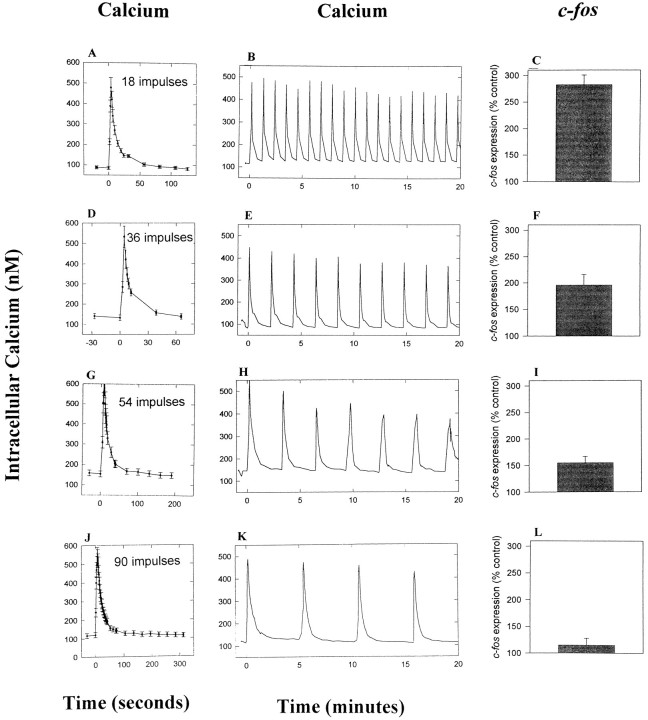
Fig. 4.
Relation between electrically induced calcium transients and c-fos expression in response to different patterns of electrical stimulation. DRG neurons were stimulated with a total of 540 action potentials delivered in four different patterns for 30 min, as in Figure 3A, and the intracellular calcium transient was measured in the cell body by using ratiometric fluorescence imaging of cells loaded with the calcium indicator fura-2.A, D, G, J, The average calcium response of several neurons (n = 27, 35, 42, and 52 neurons) is shown in response to a single burst of stimulation at 10 Hz for different durations (1.8–9 sec). Higher peak calcium levels are reached after longer duration stimulus bursts, but the differences are small relative to the increase produced by a 1.8 sec burst (A vsJ). B, E, H, K, Long-term calcium recordings showing the average intracellular calcium levels in response to stimulus bursts repeated at different intervals (1–5 min). Note the full recovery of calcium to prestimulus levels after all stimulus patterns. C, F, I, L, Expression ofc-fos, measured by semiquantitative PCR (n = 31 cultures), does not correlate with the amplitude of the calcium transient but does correlate with the interval between stimulus bursts. This relation holds despite the countervailing differences in peak calcium produced by longer duration bursts.

