
Fig. 11.
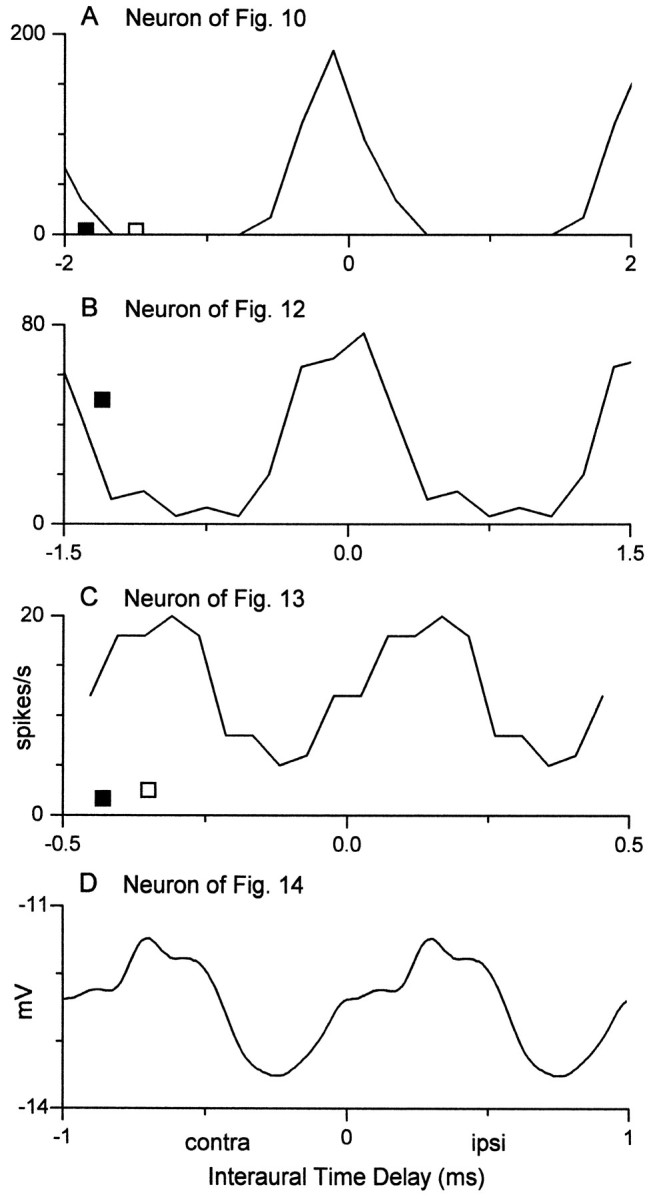
Interaural delay curves generated from the response to the binaural-beat stimulus (for details, see Yin and Kuwada, 1983; Kuwada et al., 1987). A–D, From neurons in Figures 10, 12, 13, and 14, respectively. A–Creflect spike rates, whereas D was derived from the synaptic potentials synchronized to the beat frequency in Figure 14. Response in C represents average spike rates to 25 cycles of the binaural-beat frequency. Open andfilled squares denote spike rates (spikes per second) to contralateral (contra) and ipsilateral (ipsi) stimulation, respectively.