
Fig. 13.
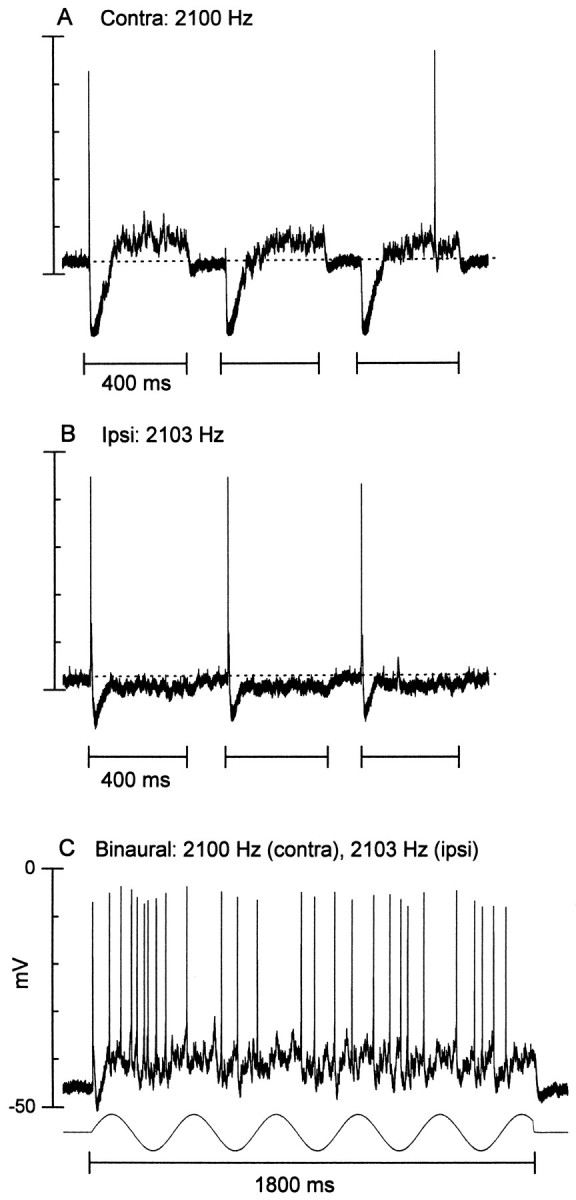
An ITD-sensitive neuron that had an inhibitory–excitatory response to contralateral stimulation and an excitatory–inhibitory response to ipsilateral stimulation.A, Response to three sequential contralateral (Contra) tone bursts (80 dB SPL). B, Response to three sequential ipsilateral (Ipsi) tone bursts (80 dB SPL). C, Response to a 3 Hz binaural-beat stimulus (contra, 2100 Hz; ipsi, 2103 Hz; both at 80 dB SPL). The sinusoid (bottom) is at the beat frequency. The discharge follows the beat frequency, and this is seen more clearly in Figure 11C, where the response to the binaural-beat stimulus is plotted as a function of ITD.