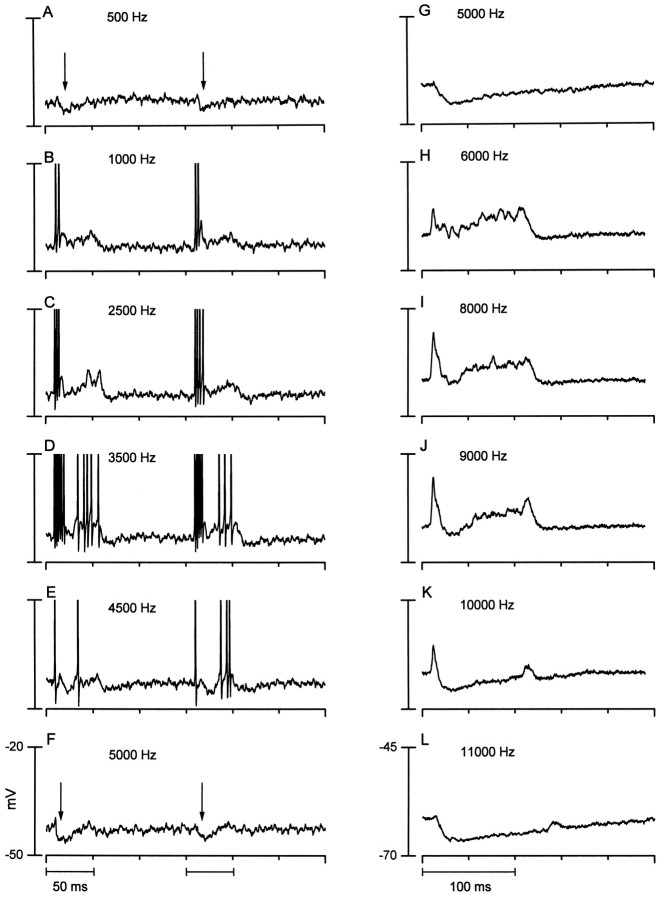
Fig. 3.
Two neurons that displayed inhibitory side bands.A–F (left column), Responses of one neuron to tone bursts from 500 to 5000 Hz. Each panel is the response to two successive tone bursts (80 dB SPL) at the frequencies indicated. The best frequency was 3500 Hz (D).Arrows mark the transient hyperpolarizations seen at the edges of the response area of this neuron (A, F). Action potentials have been cropped. Responses are from the neuron of Figure 1G. G–L (right column), Responses of another neuron to tone bursts from 5 to 11 kHz. Here, the responses to six identical tone bursts (65 dB SPL) were averaged at each of the frequency indicated. Best frequency is near 9 kHz (J).

