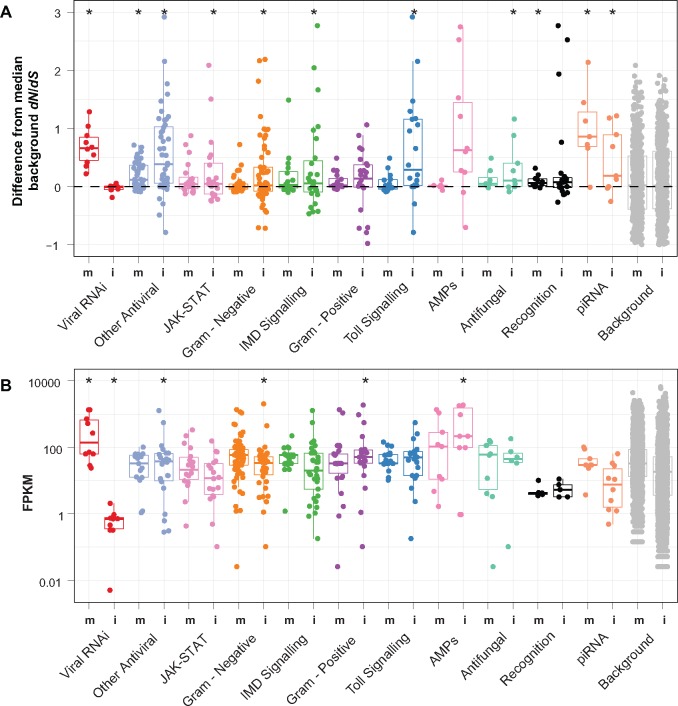
Fig. 3.
Fast evolving immune gene categories differ between species. (A) For each immune gene or RNAi gene, we have calculated the difference in dN/dS between the gene and the mean of background genes of similar dS (+-0.01dS). i refers to the Drosophila innubila branch while m refers to the D. melanogaster branch. A P value (from a single sample, two-sided t-test looking for significant differences from 0) of 0.05 or lower is designated with *. (B) Expression as read counts per 1 kb of exon for each gene (FPKM) by immune gene in each species. For each category, we have overlaid a boxplot showing the median (center line) and interquartile range for each category in both species groups, with whiskers to 97.5% of the next interquartile. i refers to D. innubila while m refers to D. melanogaster. Categories marked with a * are significantly different from the background category with a Mann–Whitney U test (P <0.05).

