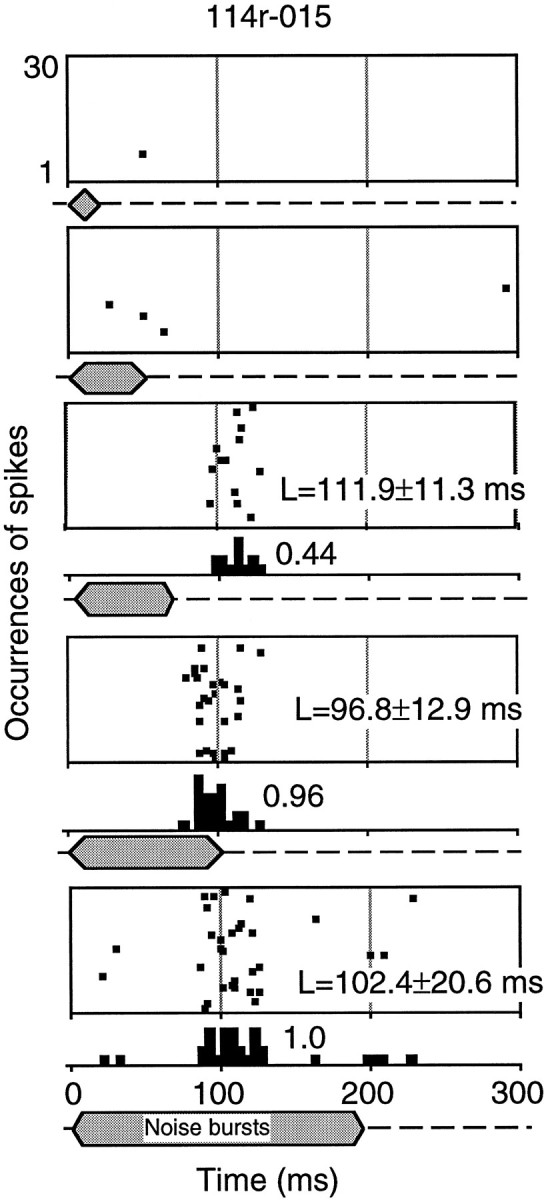
Fig. 3.

Responses of a long-latency neuron (114r-015). Raster displays (30 trials) show the times of occurrence of spikes elicited by noise bursts of varied duration (80 dB SPL). PSTHs for stimuli of 70, 100, and 200 msec durations are shownbelow the raster displays. Normalized discharges (number of spikes divided by the maximal number of spikes) are shown bynumbers over the PSTHs. Duration of noise bursts is indicated below the raster displays or PSTHs. The response latencies (L), calculated by averaging the first spikes of all effective repeated trials of a stimulus, are shown with their SDs. The influence of spontaneous firing on the latency calculation was eliminated by restricting the spikes used in the calculation to a limited time period according to the firing pattern. The calculation was made using the software package of the MALab system.
