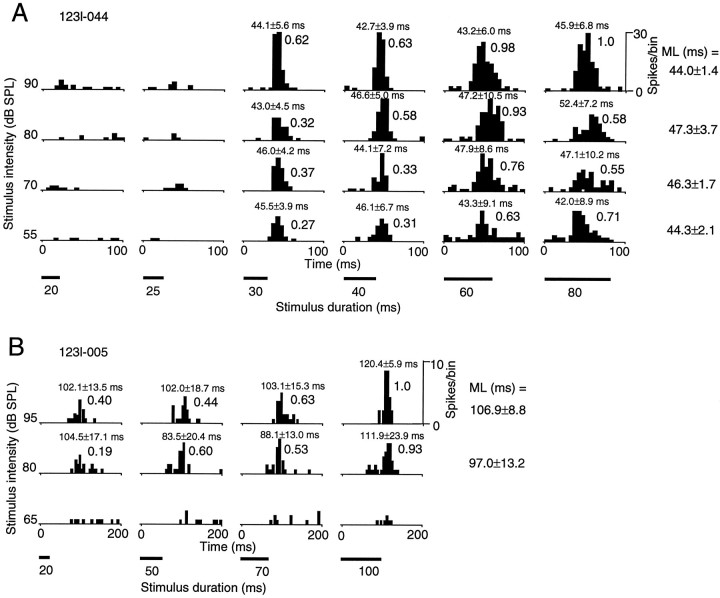
Fig. 6.
PSTHs showing responses of two long-duration-selective neurons, 123l-044 (A) and 123l-005 (B), to noise bursts of varied duration and varied intensity. Duration of noise bursts is shown by the length of the black bars under the PSTHs. Number of spikes per bin (bin width, 5 msec) shown in top right corner applies in each figure to all PSTHs. The PSTHs of both neurons were summed over 30 trials. Decimal digits over the PSTHs indicate the normalized responses. The response latency for each stimulus was calculated in the same manner shown in the legend to Figure 3 and is shown above each PSTH. The mean latency (ML), shown to the right of each row, is the average over stimuli of the same intensity and varying durations.

