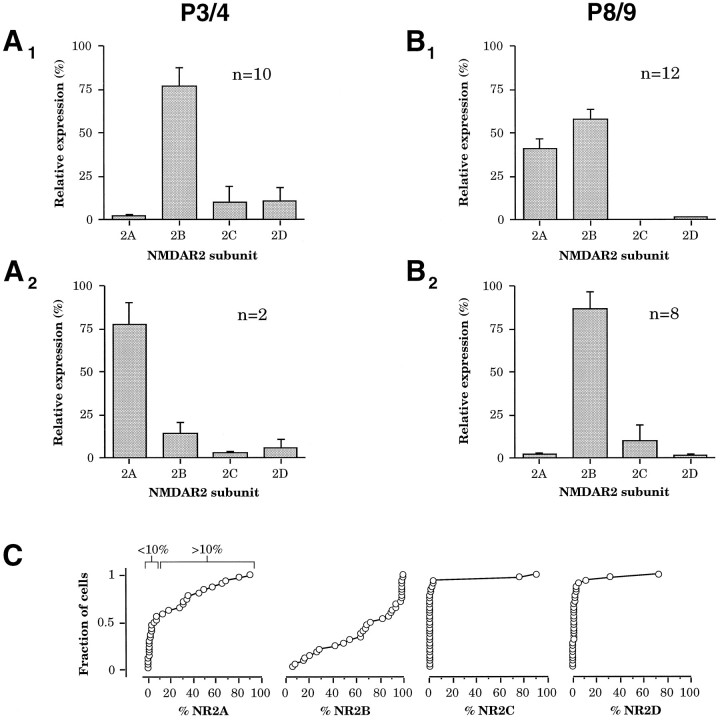
Fig. 4.
Age-dependent patterns of single-cell NR2 subunit expression. A1,A2, Two groups could be discerned at P3/4 on the basis of NR2A subunit expression.A1, The majority of cells atP3/4 did not express NR2A above background but expressed high relative levels of NR2B (n = 10).A2, Two of 12 cells atP3/4 did express relatively high levels of NR2A.B1,B2, Two groups were apparent atP8/9 on the basis of NR2A expression.B1, A majority of cells (n = 12) expressed NR2A along with NR2B.B2, Eight of 20 cells expressed no significant NR2A and expressed high relative levels of NR2B.C, Cumulative histogram of percentage of relative expression of each NR2 subunit obtained from the 32 neurons in both age groups, demonstrating that relative NR2A andNR2B subunit expression is highly regulated in this population (left 2 panels). In contrast, very few cells expressed NR2C or NR2D (right 2 panels).

