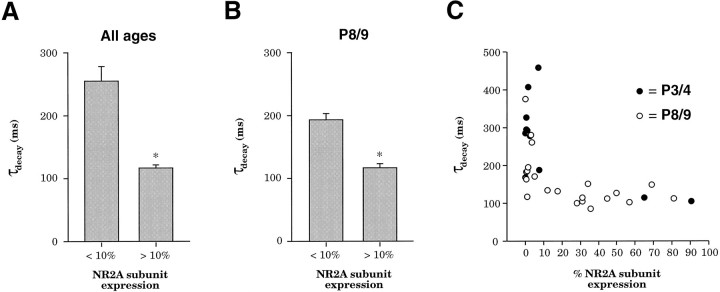
Fig. 5.
NR2A subunit expression decreases the time course of NMDAR EPSCs. A, Neurons in both age groups (P3/4 and P8/9) with lower than background NR2A expression (<10%; mean 2.1 ± 0.5% NR2A) had a longer mean NMDAR EPSC decay time constant than neurons expressing NR2A above background (mean 46.2 ± 6.3% NR2A). B, Neurons at the same age (P8/9) that did not express NR2A (<10%; mean 2.1 ± 0.5% NR2A) had a longer mean NMDAR EPSC decay time constant than neurons that did express NR2A (mean 40.9 ± 5.9% NR2A). *Difference significant at p < 0.0005; two-tailed Student’s t test. C, Relationship between relative NR2A subunit expression and NMDAR EPSC decay time constant, demonstrating a low apparent threshold of NR2A expression required to decrease NMDAR EPSC duration. Each point represents data from a single cell at either P3/4(black circles) or P8/9 (white circles).

