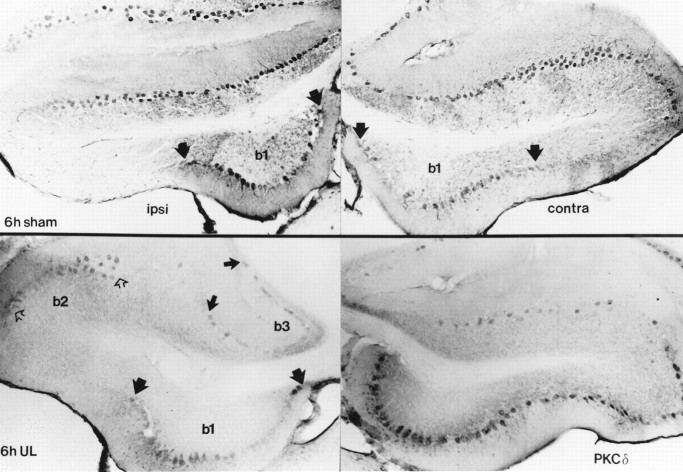
Fig. 8.
Distribution of PKCδ expression in sections through Long–Evans rat cerebellar flocculus. As in the nodulus and uvula, immunoreactivity is restricted to the Purkinje cells of the cerebellar cortex. The flocculus ipsilateral to the operation is shown on the left side and the contralateral flocculus is shown on the right side of the figure. Six hour, post-sham-operated rat flocculi (top panels) show a variable but consistently symmetric pattern of Purkinje cell immunoreactivity along the dorsal and ventromedial (b1, demarcated by wide black arrows) surfaces. Six hour, post-UL flocculi (lower panels) show the ventromedial distribution of expression as in the sham, with the appearance of bands of expression along the lateral crest of the ipsilateral flocculus (b2, open arrows) and the border with paraflocculus (b3, narrow black arrows). The contralateral flocculus shows a broader area of distribution than ipsilaterally, with expression between areas b1 andb2, and b2 and the lateral margin of b3. Contralaterally, areab3 shows only a sparse distribution of immunoreactive Purkinje cells. Immunoreactivity for PKCα and -γ shows an identical distribution.

