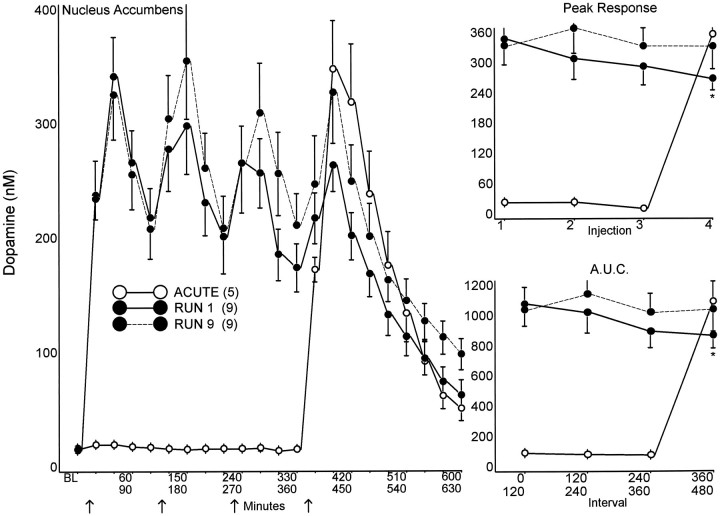
Fig. 3.
NAC extracellular DA in response to the first and ninth 8 mg/kg AMPH run, compared with a single acute injection of 8 mg/kg AMPH. Dialysis samples were collected at 30 min intervals andBL (baseline) represents the median value of the three samples collected immediately before the first injection. AMPH or saline was administered every 2 hr (arrows). The peak response for each injection, and the area under the curve (A.U.C.) for the 120 min interval after each injection are summarized in the graphs on the right(ANOVA: Peak Response, F = 3.58,p < 0.05, t = 2.51;A.U.C., F = 3.02,p < 0.05, t = 2.92). *p < 0.05 compared with the first injection of the same run.

