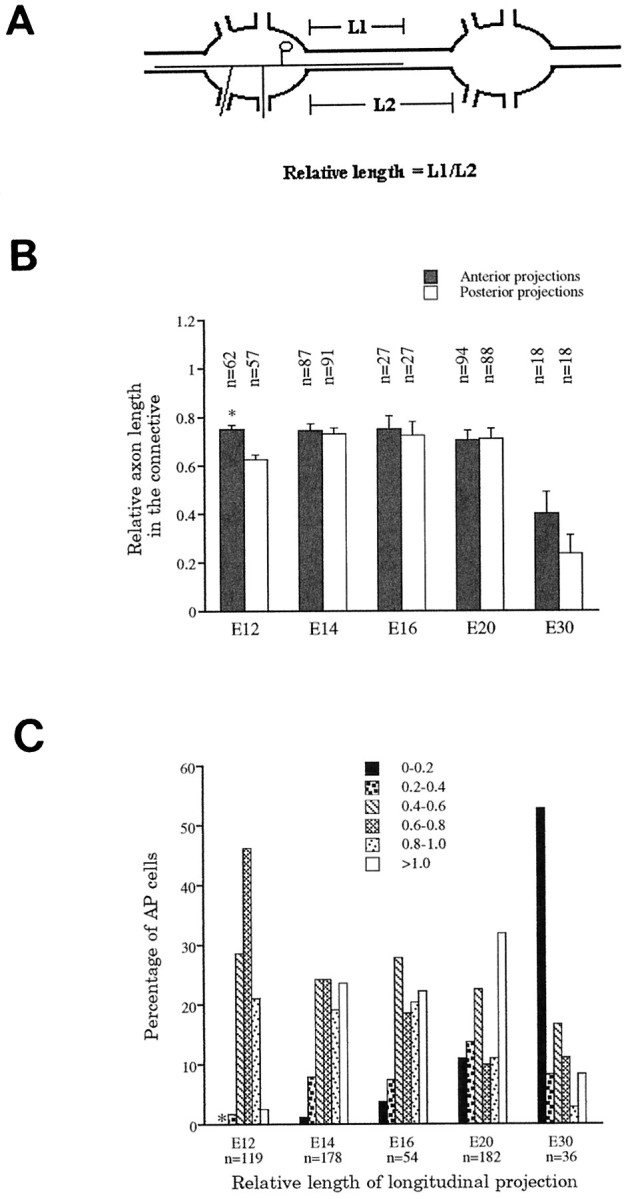
Fig. 2.

Relative lengths of the longitudinal projections as a function of time in development. A, Diagram showing the parameters measured to obtain the relative lengths of the AP longitudinal projections in the connective nerve between adjacent ganglia (L1/L2). B, Comparison of relative lengths in the posterior and anterior directions at different stages. Only at E12 are the differences in relative length significant, with the anterior projections (*) slightly longer (p < 0.005). BetweenE12 and E20, average relative lengths remain the same, but a large reduction was found at E30. In the adult, these projections are effectively absent.C, The distribution of relative lengths changes with embryonic age. Anterior and posterior longitudinal projections were not distinguished here. The asterisk associated with the left-most data point at E12 denotes that there are no longitudinal projections with relative lengths between 0 and 0.2 at this stage.
