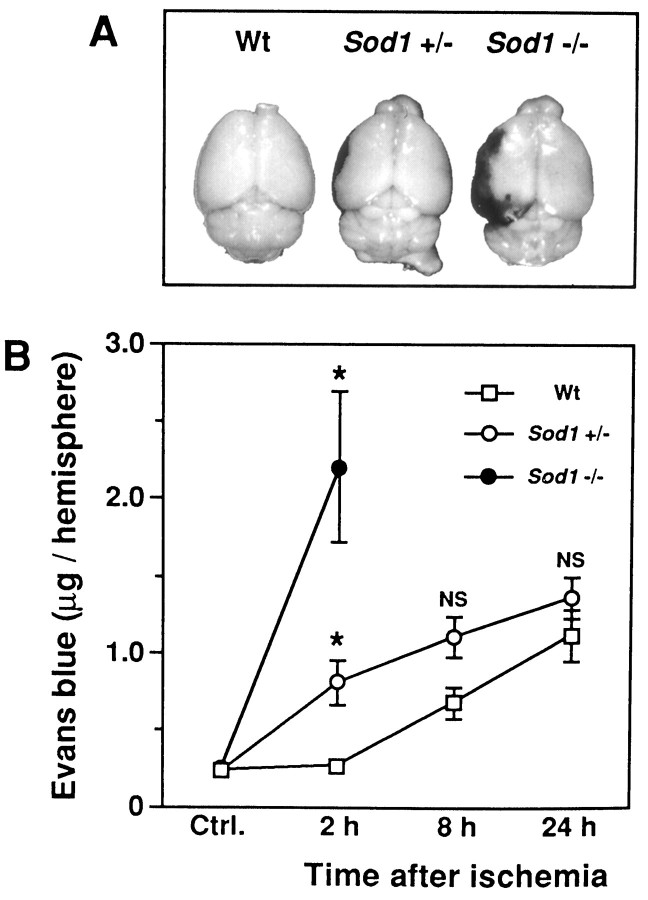
Fig. 2.
Evans blue extravasation in mutant mice after ischemia. A, Representative photographs of Evans blue extravasation in the brains of Wt mice, heterozygous (Sod1 +/−) and homozygous (Sod1 −/−) mutants 2 hr after ischemia. The dark stained area in the left hemisphere indicates Evans blue extravasation. B, Quantitative assay of Evans blue at 2, 8, or 24 hr after ischemia. Values are mean ± SEM of the amount of Evans blue in the hemisphere. Ctrl., Basal value of Evans blue in the nonischemic hemisphere of Wt (n = 16),Sod1 +/− (n = 19), orSod1 −/− (n = 5) mice. Data in respective time points indicate the amount of Evans blue in the ischemic hemisphere of Wt, Sod1 +/−, orSod1 −/− mice (n = 4–8).Asterisks indicate a significant increase of Evans blue leakage compared with Wt mice (p < 0.01), and NS indicates no significance between Wt andSod1 +/− (Fisher’s PLSD test).

