
Fig. 6.
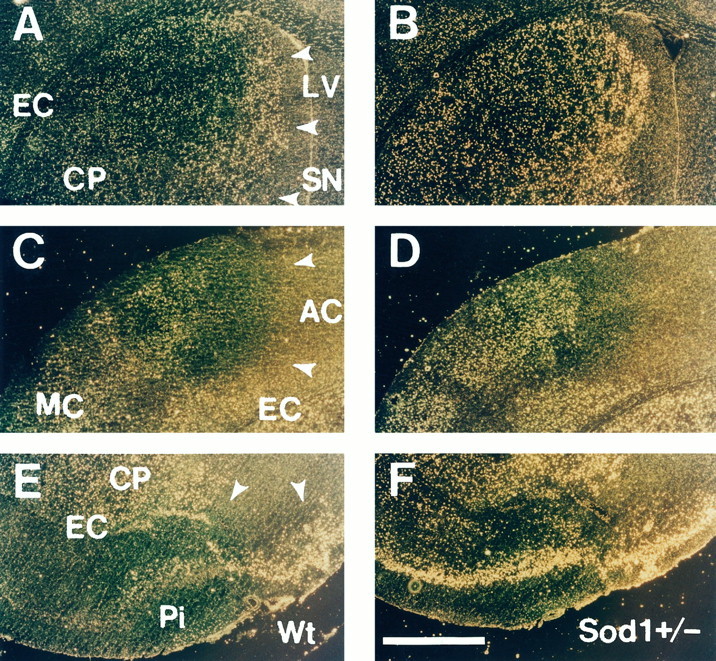
Distribution of TUNEL-positive neurons in Wt and Sod1 +/− mice. Representative dark-field phase-contrast photographs of TUNEL staining in Wt (A,C, E) and heterozygous mutant (B, D, F) mice at 24 hr after 1 hr of MCA occlusion. Normal, noninfarcted area gives yellow reticular background, and infarct area is defined as dark area (A, C, E,arrowheads). In the infarcted area, bright yellow spots representing apoptotic neurons with dense TUNEL labeling and faint yellow spots representing necrotic neurons with slight TUNEL labeling are observed. In the caudate putamen, the apoptotic neurons are located primarily at the margin of the inner boundary, and the center of the caudate putamen was occupied with necrotic neurons in Wt mice (A). In contrast, apoptotic neurons were increased in the margin of the inner boundary and extend to the center of the caudate putamen in Sod1+/− mice (B). In the cortical penumbra, an increased number of apoptotic neurons is observed in Sod1 +/− mice (D), compared with Wt mice (C). In the piriform cortex, apoptotic neurons are scarce in Wt mice (E), whereas almost all neurons show apoptotic features in Sod1 +/− mice (F).LV, Lateral ventricle; CP, caudate putamen; EC, external capsule; SN, septal nucleus; AC, territory of anterior cerebral artery;MC, territory of middle cerebral artery;Pi, piriform cortex. Scale bar, 500 μm.