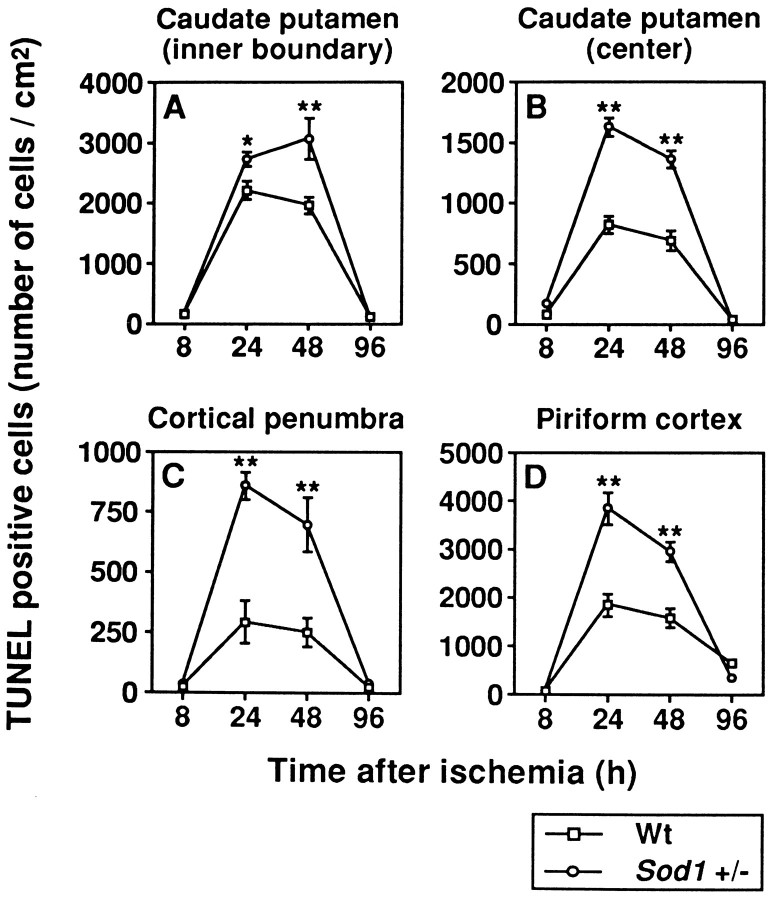
Fig. 7.
Temporal profile of TUNEL-positive neurons in Wt and Sod1 +/− mice. Apoptotic neuronal cells were counted at 8, 24, 48, and 96 hr after 1 hr of MCA occlusion in the inner boundary of the caudate putamen (A), the center of the caudate putamen (B), the cortical penumbra (C), and the piriform cortex (D). Data are expressed as cells/mm2 (for details, see Results). Data represent mean ± SEM (n = 4).Asterisks indicate a significant increase, compared with Wt mice (*p < 0.05, **p < 0.01; Fisher’s PLSD test).

