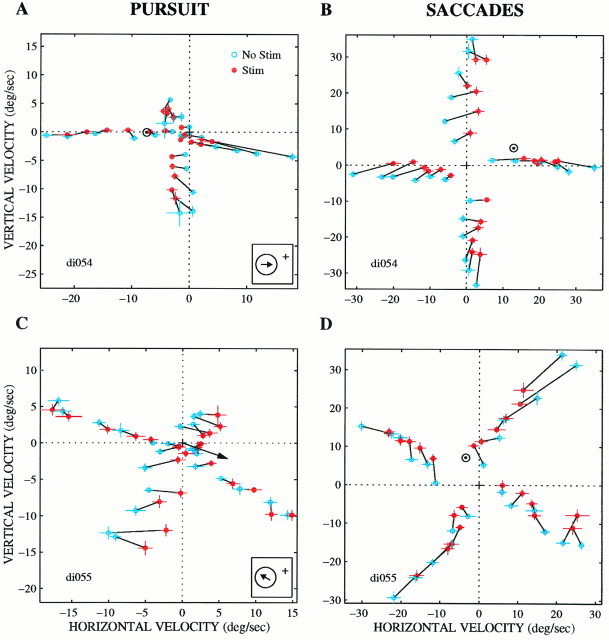
Fig. 13.
Two examples of experiments in which microstimulation affected pursuit and saccadic target velocity compensation differently. The data shown in C are the same as in Figure 9A. Conventions are the same as Figures 8, A and B, and 9. The receptive field location for the experiment in A andB was 27° to the left, 11° down, the preferred direction was 0° (inset), the receptive field diameter was 20°, and the preferred speed was 40°/sec. Targets moved in one of four directions (0, 90, 180, or 270°) at one of six speeds (5, 10, 15, 20, 25, or 30°/sec). The current level was 40 μA for both sites. Centroids (⊙) are shown in A, B, D. Because the data in C show a vector summation pattern, the magnitude of the centroid is undefined, and the direction of the centroid is shown by the arrow.

