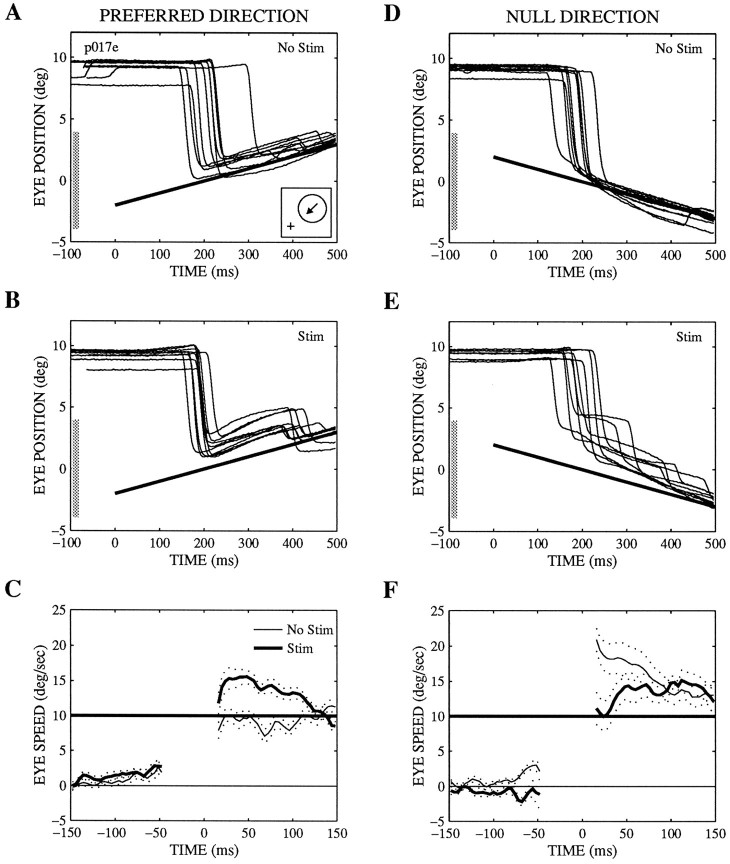
Fig. 3.
Effects of microstimulation on pursuit and saccadic target velocity compensation at one microstimulation site.A, B, D, E, Eye position versus time for targets moving in the preferred (A, B) or null (D, E) direction of the site on nonstimulated (No Stim; A, D) or stimulated (Stim; B, E) trials. The effects of stimulation on saccadic velocity compensation can be seen in these panels, whereas the effects on pursuit are best appreciated inC and F, which show averaged traces of eye speed versus time for the same trials. The dotted lines represent the SEs of the average traces. The individual trials were aligned on the end point of the saccade (time 0), and the saccade itself was excised before the average traces were computed. Note that the time axis is expanded in these panels to demonstrate more clearly the effects on pursuit during the first 20–150 msec after the saccade. [The greater speed of the initial pursuit on nonstimulated trials for null direction motion (F) than for preferred direction motion (C) reflects a naturally occurring asymmetry in pursuit speed.] The position traces show the position component along the preferred–null axis (with the preferred direction positive), whereas the speed traces show speed in the direction of target motion. The position traces (A, B, D, E) are aligned on target onset (time 0). The position and motion of the target are indicated by thethick straight lines. Inset in A,Receptive field location (circle, to the right 6.8°, up 5.6°) and the preferred direction of motion (arrow, 225°). As described in Materials and Methods, the fixation point was offset so that the receptive field was centered on the monitor (position 0). The diameter of the receptive field was 8°, as indicated by the shaded bars on the position axes of A, B, D, E. The preferred speed was not measured at this site. The current level was 20 μA on stimulated trials.

