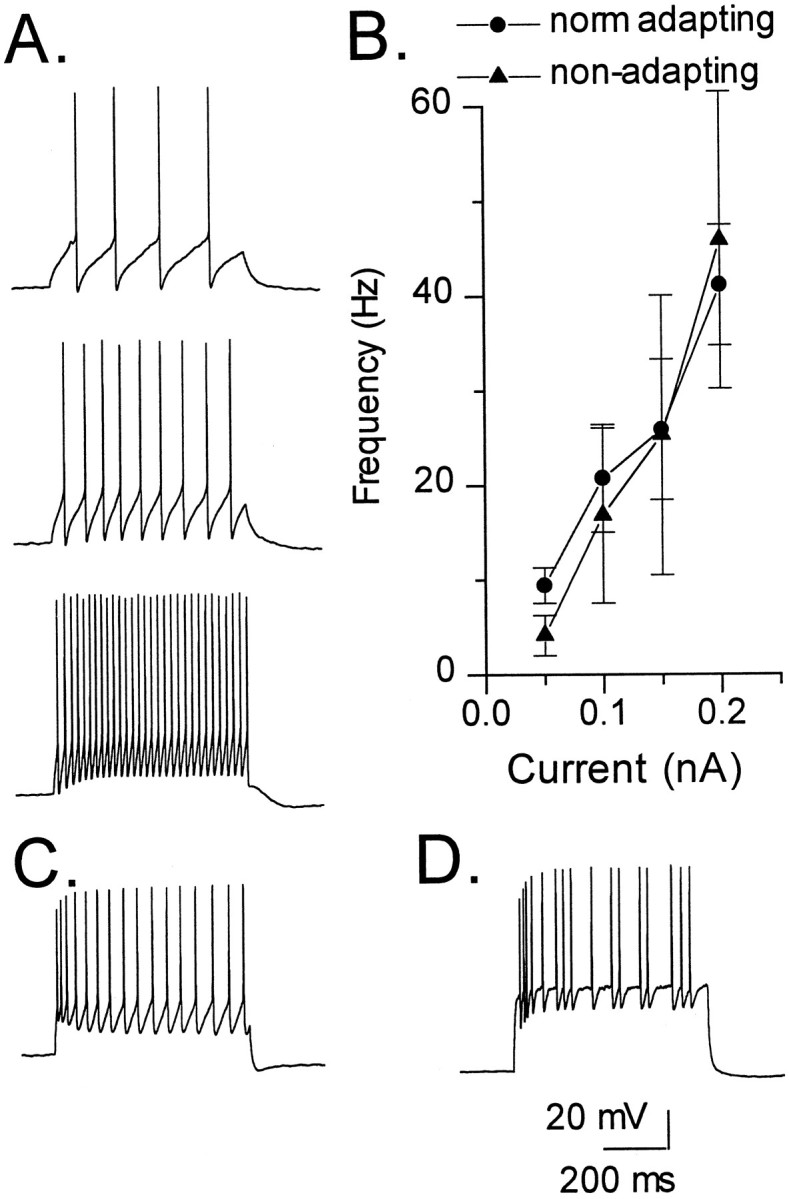
Fig. 11.

Frequency–current (F–I) curves and firing patterns of interneurons. A, This IML cell (shown in Fig.3B) is an example of the response of a nonadapting interneuron to increasing levels of depolarizing current (0.07, 0.1, and 0.2 nA, respectively). SFA was not apparent at any level of current injection. This cell fired action potentials in a continuous manner during a depolarizing current pulse. Note that this pattern of discharge remained constant even when the amplitude of the current pulse was increased. B,F–I curves of normally adapting (n = 12) (circles) and nonadapting (n = 4) (triangles) interneurons (symbols and error bars represent mean ± SEM). Note the lack of a difference in initial firing frequency between these groups of interneurons. C, D, Examples of TML cells with normal adaptation showing the two different patterns of discharge. The cell in C displays a continuous firing pattern in response to a 0.2 nA depolarizing current pulse, whereas the cell inD exhibits a discontinuous firing pattern in response to a 0.4 nA depolarizing current pulse.
