Fig. 7.
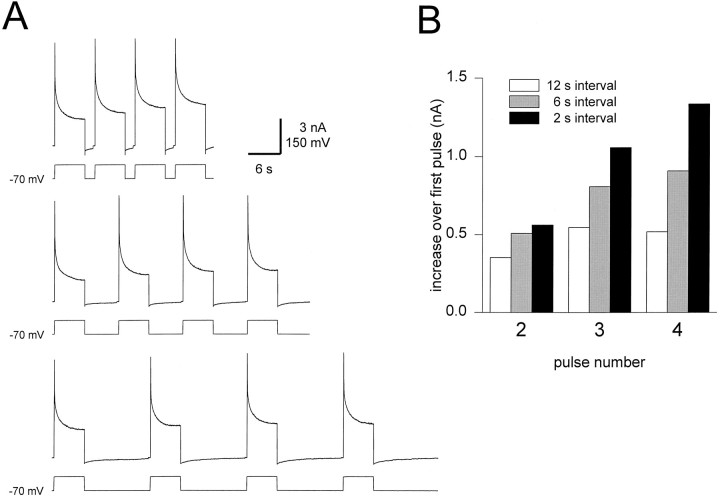
Cumulative activation ofIKF. A, A sequence of 6 sec pulses to 0 mV were applied from a holding potential of −70 mV. The interpulse interval was varied from 2 sec (top traces) to 6 sec (middle traces) to 12 sec (bottom traces). The accumulation of gKF was reduced by increasing the interpulse interval. The calibration bar refers to all three sets of traces. B, Increase in the amplitude of IK at the end of the 6 sec pulse. The difference between the amplitude of the current at the end of the first pulse and at the end of each consecutive pulse is plotted. For the 2 sec interpulse period (black), the increase was large and did not saturate over the four pulses. For the 12 sec interpulse period (white), the increase was small and saturated. The 6 sec interpulse period (gray) was intermediate between the 2 sec interval and the 12 sec interval case in amplitude increase.

