
Fig. 7.
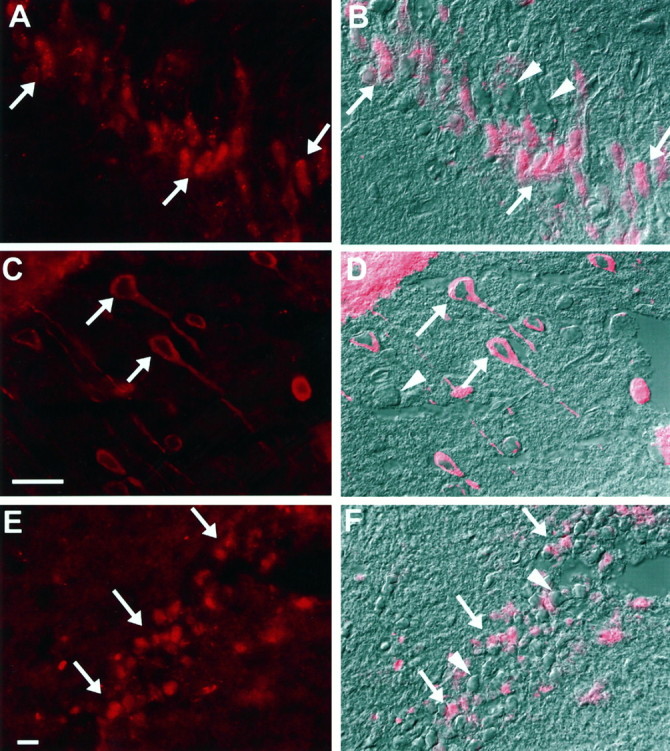
Immunofluorescent and differential interference contrast (DIC) images showing bcl-2 immunoreactivity in neurons after TBI in rats (bcl-2 labeling = red).A, B, CA3 hippocampus 24 hr after TBI (A, fluorescent image; B, DIC image with fluorescent overlay). C, D, Cortex 72 hr after TBI (C, fluorescent image; D, DIC image with fluorescent overlay). E, F, Dentate gyrus 72 hr after TBI (E, fluorescent image;F, DIC image with fluorescent overlay). Note both bcl-2 immunopositive (arrows) and immunonegative (arrowheads) neurons in each region. Scale bars:A, B, E, F, 25 μm; C,D, 25 μm.