
Fig. 1.
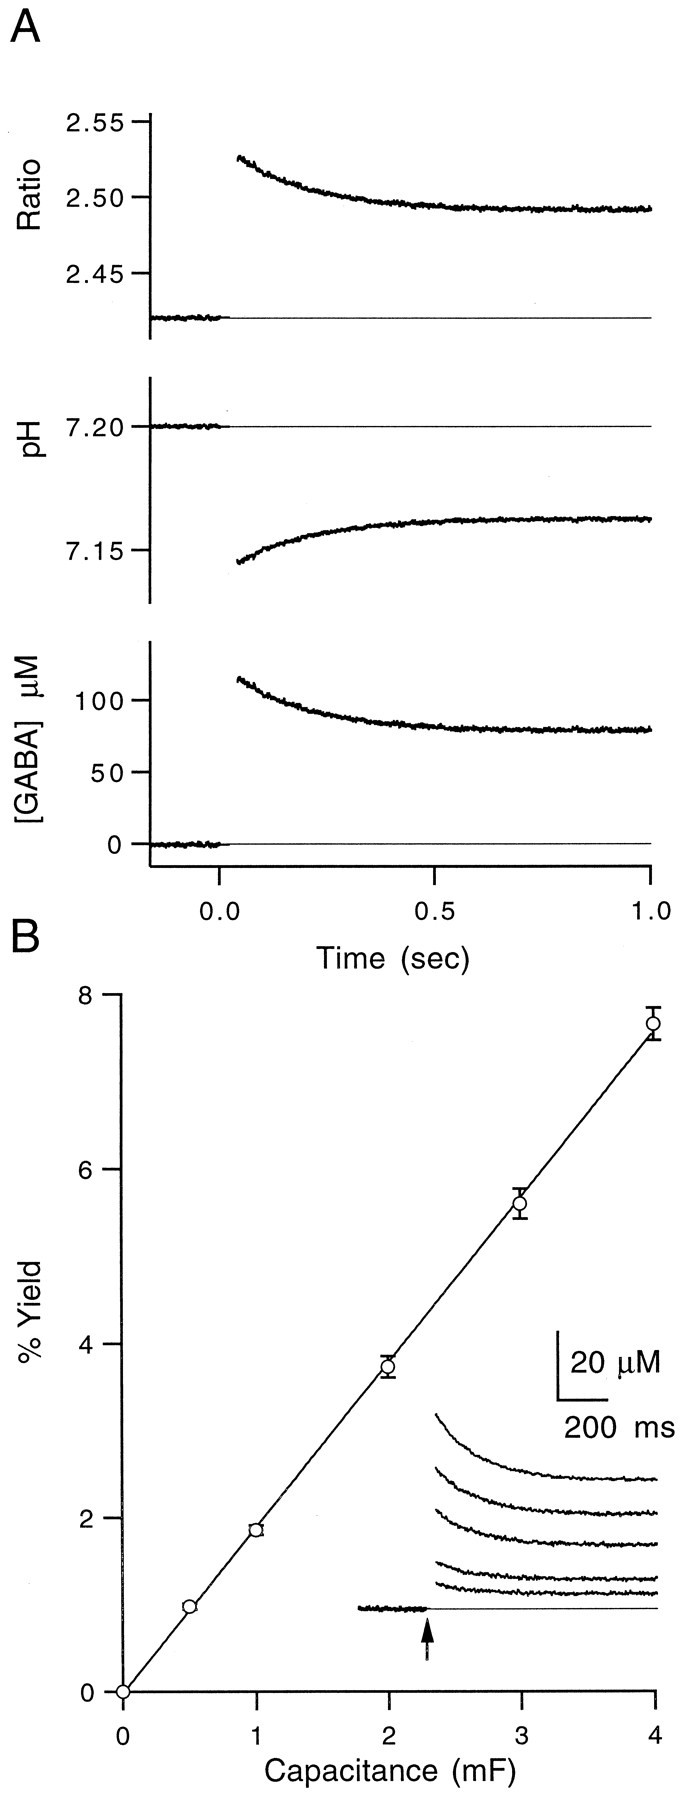
Photolysis calibrations using pH-sensitive fluorophores. A, Top, Ratio of two SNARF emission wavelengths before and after UV flash att = 0. Middle, Ratiometric estimate of pH after UV flash as described in Materials and Methods.Bottom, Calculated concentration of free GABA uncaged as described in Materials and Methods. All traces are averages of three trials. B, Average of eight calibration experiments showing the amount of uncaging at a variety of flashlamp output levels. Data were fit to a line with a slope of 1.9%/mF (data points are mean ± SEM, n = 8). Inset, Calculated free GABA concentration after UV flash at five capacitance levels for a representative experiment. Arrow marks the time of flash. Traces are averages of three trials.