
Fig. 3.
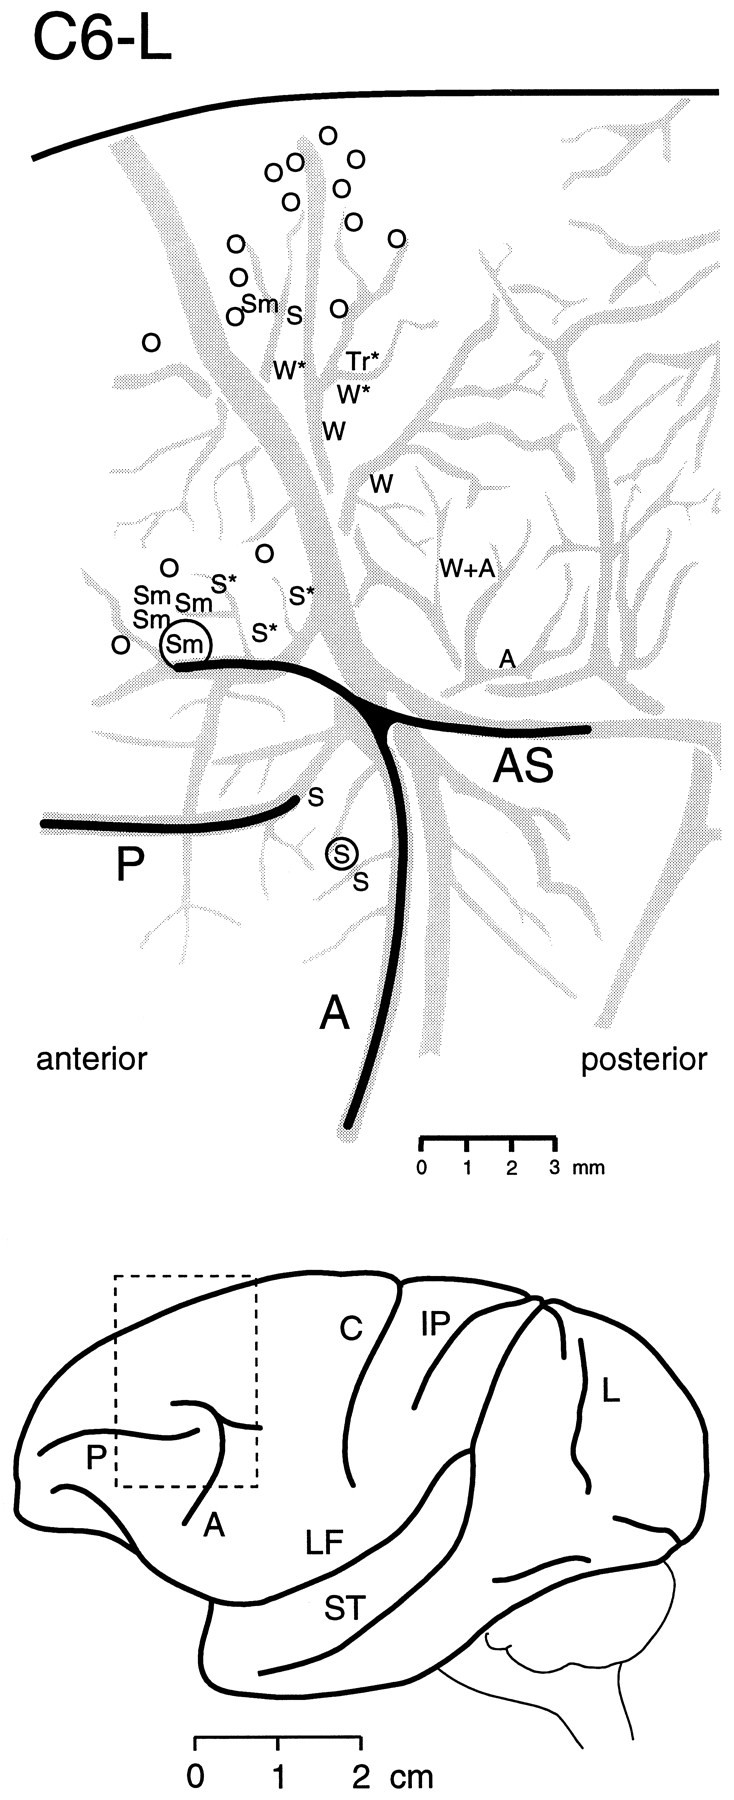
Top, A typical microstimulation map within a region including the frontal eye field, the supplementary eye field, and the dorsal premotor cortex of monkey C6, left hemisphere (C6-L). The map was reconstructed by projecting and tracing a photograph made through the operating microscope of the cortical blood vessels (gray) and then plotting the position of each electrode penetration from individual electrode placement photographs. The locations where movements were elicited at thresholds <50 μA are indicated by letters: S, saccade; Sm, smooth eye movement; Tr, trunk muscle contraction; W, wrist flexion or dorsiflexion; W+A, wrist dorsiflexion evoked superficially in cortex plus forearm pronation and abduction evoked deeper in cortex; A, supination of forearm; and O, no response. Anasterisk indicates responses evoked at high threshold (>50 μA); a circle around a stimulation point indicates the location of a tracer injection (see also Fig. 4).Bottom, A lateral view of the hemisphere. Thedotted rectangle indicates the location of the microstimulation map. A, Arcuate sulcus;AS, arcuate spur; C, central sulcus;IP, intraparietal sulcus; L, lunate sulcus; LF, lateral fissure; P, principal sulcus; ST, superior temporal sulcus.