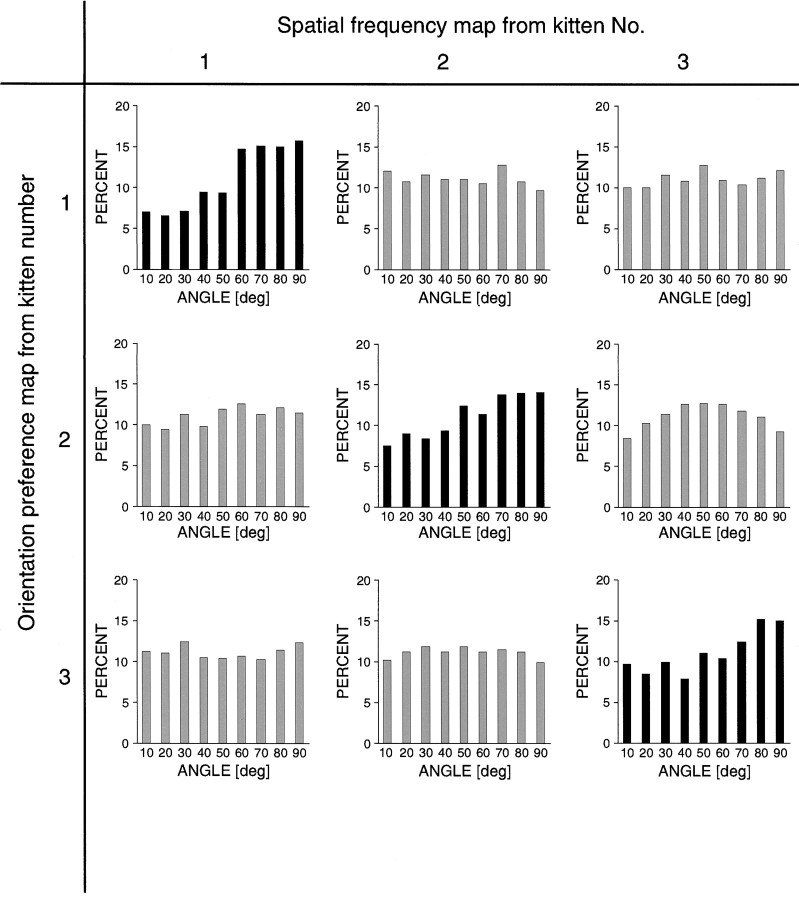
Fig. 10.
Intersection angles of iso-orientation lines with borders between spatial frequency domains. Nine histograms are shown in the form of a 3 × 3 matrix. The black histogramsalong the diagonal show the distribution of intersection angles from three kittens. Large angles (black histograms) are clearly over-represented, whereas this is not the case in the controls (gray histograms).

