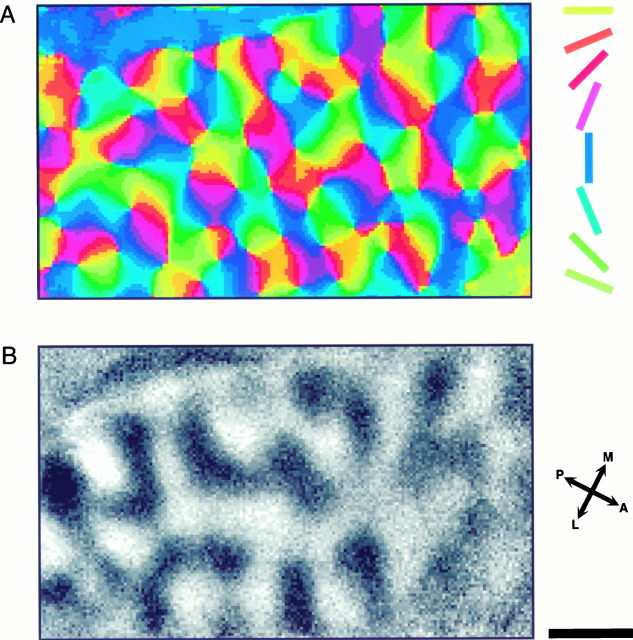
Fig. 2.
Orientation preference “angle map” and ocular dominance map from the same patch of cortex. A, Orientation preference map calculated from the iso-orientation maps shown in Figure 1. The angle of the preferred orientation is color-coded according to the key shown on the right. As described previously, orientation domains are organized in a pinwheel-like manner. B, Ocular dominance map. Blackcodes for contralateral and white for ipsilateral eye preference. The layout of the ocular dominance map is clearly different from that of the iso-orientation maps shown in Figure 1. Scale bar, 1 mm.

