
Fig. 5.
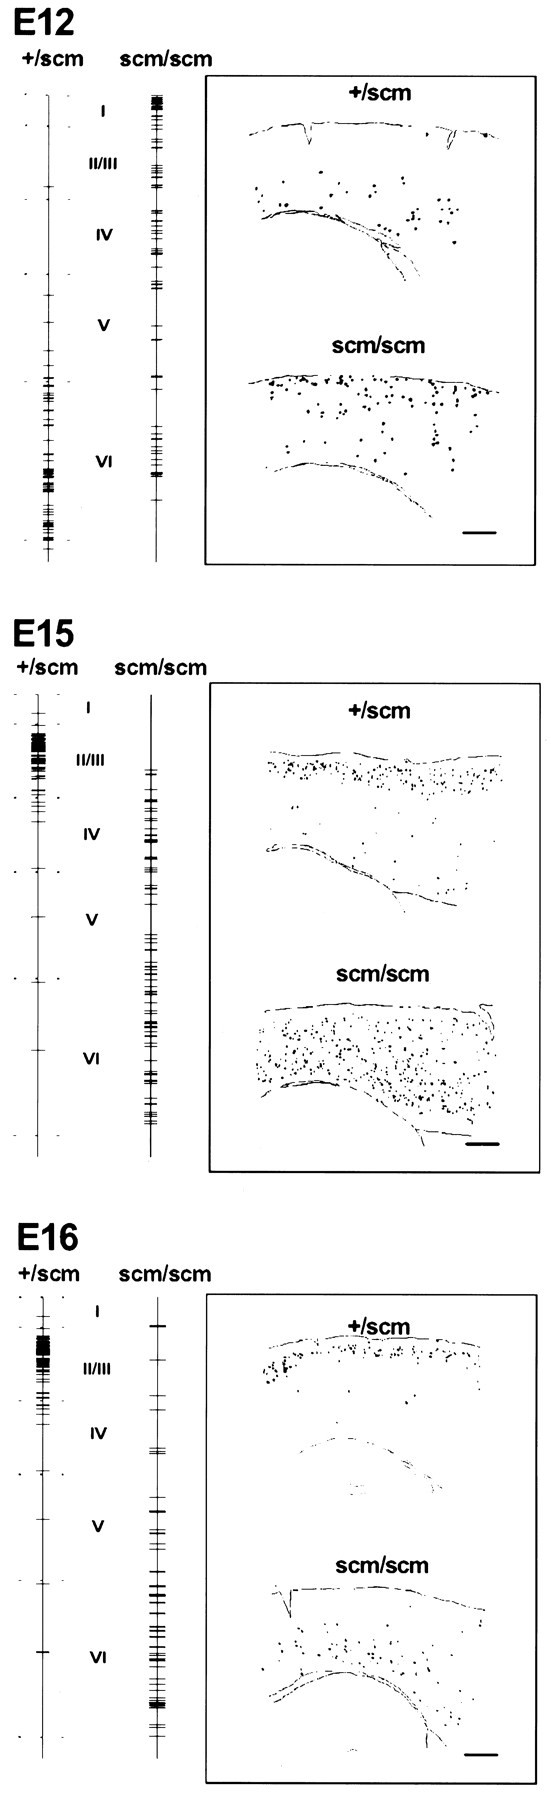
Summary patterns of BrdU labeling after injection at E12, E15, and E16. The positions of BrdU-labeled cells are represented by horizontal lines drawn on avertical line extending the thickness of the cortex from pia to white matter. Each tick mark on thevertical line represents a single BrdU-labeled neuron. Each line combines the vertical position of all BrdU-labeled neurons from the camera lucida drawing of a region of the parietal cortex, lying dorsal to the hippocampus, of a single sagittal section. (See Materials and Methods for details.) The approximate boundaries of each layer are indicated for normal cortex. For each labeling age, samples of camera lucida drawings from BrdU-labeled normal and scm/scm brain sections are displayed in the insets. Scale bars, 400 μm.