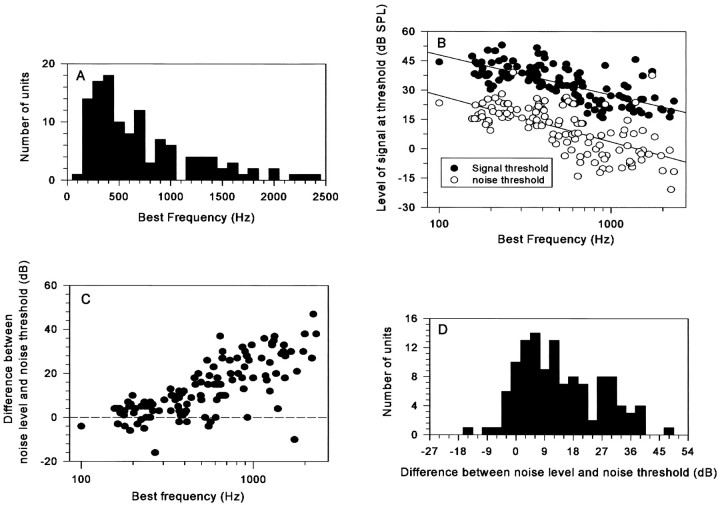
Fig. 1.
A, Histogram of the BF distribution of 121 units. B, Threshold levels for binaurally presented BF signals and No noise. C, Difference between No level and noise threshold plotted against the BF of the units.D, Histogram showing the level of the No noise with respect to noise threshold for the 121 units.

