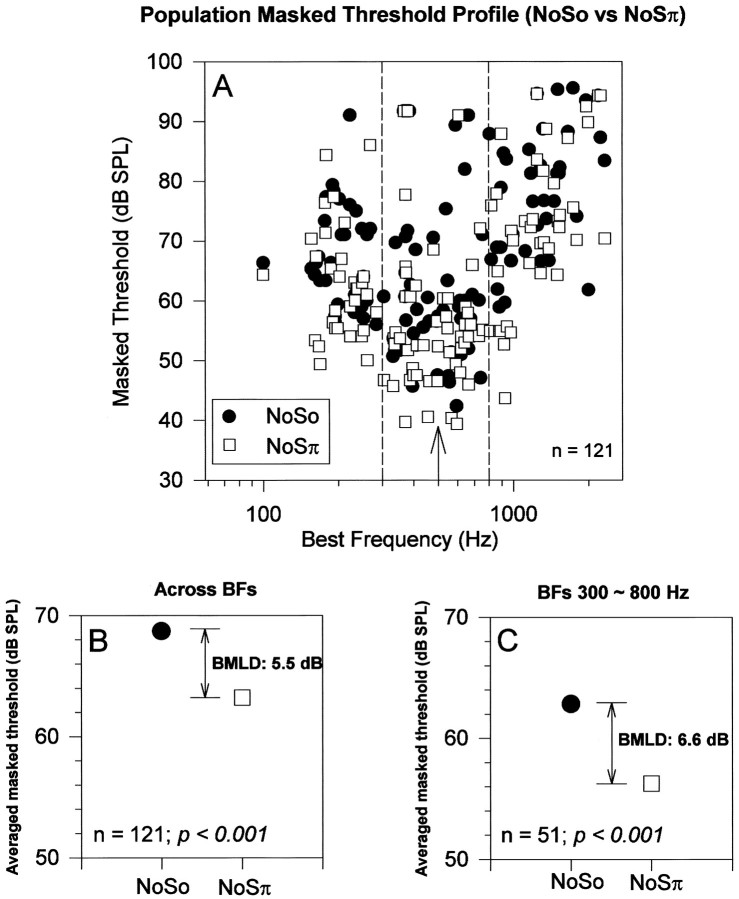
Fig. 4.
Masked thresholds for So and Sπ 500 Hz tones in No noise as a function of the neuron BF. A, Masked thresholds across a population of low-frequency inferior colliculus neurons pooled from five guinea pigs for 500 Hz tones in So (filled circles) and Sπ (open squares) configurations in the presence of a fixed level (23 dB SPL/ ) of No noise. The dashed lines indicate the region from 300–800 Hz centered around the tone frequency of 500 Hz, which is marked by an arrow. B, The average of all of the masked thresholds across this population is plotted for So (filled circles) and for Sπ (open squares). The difference between these values is significant at the p < 0.001 level by Student’st test. C, The average of the masked thresholds from the frequency range 300–800 Hz, indicated by thedashed lines in A, is plotted for So (filled circles) and for Sπ (open squares). The difference between these values is significant at the p < 0.001 level by Student’s ttest.

