
Fig. 7.
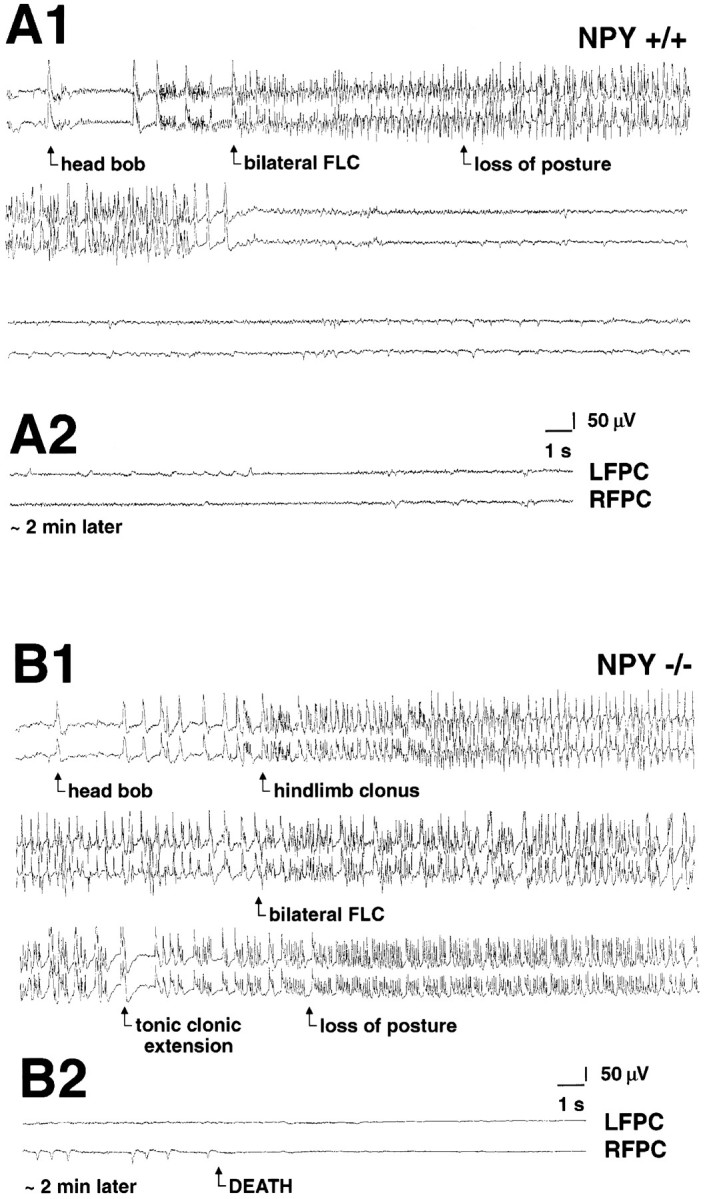
Electrographic activity during a kainate-induced seizure. A1, Representative electrographic (EEG) traces recorded from a wild-type mouse [top, left frontoparietal cortex (LFPC); bottom, right frontoparietal cortex (RFPC)] during a kainic acid-induced seizure (duration, 43 sec). EEG tracing was taken at ∼50 min after the first injection of kainic acid. A2, Same animal ∼2 min later (traces as described inA1). Note the termination of seizure activity and restoration of normal EEG activity. B1, Representative EEG traces recorded from a NPY-deficient mouse (traces as described in A1) during a kainic acid-induced seizure (duration, 220 sec). EEGtracing was taken at ∼50 min after the first injection of kainic acid. B2, Same animal ∼2 min later. Note the progression to a flat EEG associated with death of this animal.FLC, Forelimb clonus.