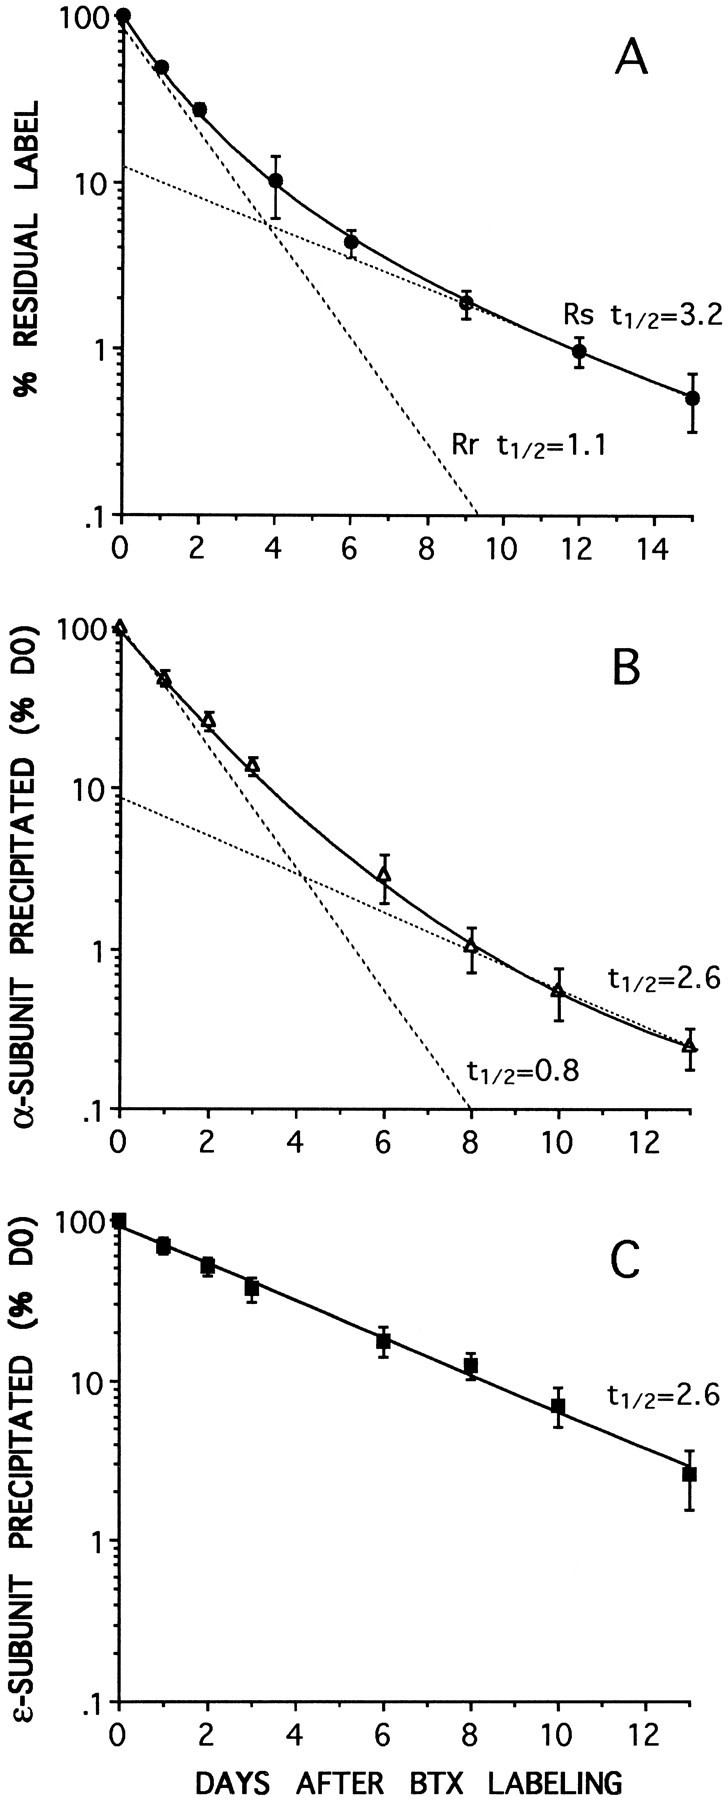
Fig. 3.

AChR degradation rates measured by either125I-BTX release (A) or by subunit-specific immunoprecipitation with anti-α (B) or anti-ε (C) subunit mAbs. At each of the time points data are expressed as a percentage of the radioactivity immunoprecipitated from the cells at the time of labeling with 125I-BTX (day 0). Biphasic degradation curves for total AChRs are obtained both by 125I-BTX release (A) or by anti-α subunit mAb 155 immunoprecipitation (B). In each case the best fit to the data (solid curve) consists of the sum of two components (dashed lines): a slow component (Rs), with at½ value of ∼3 d (3.2 and 2.6 d), and a fast component (Rr), with at½ of ∼1 d (1.1 and 0.8 d). The receptor immunoprecipitated by the anti-ε subunit mAb 168 (C) degrades as a single exponential (solid line) with at½ of 2.6 d, similar to the slow components in A and B. No fast component is seen. The values are the means ± SD of at least three different experiments. The data in B andC were obtained from the same sets of cells.
