
Fig. 4.
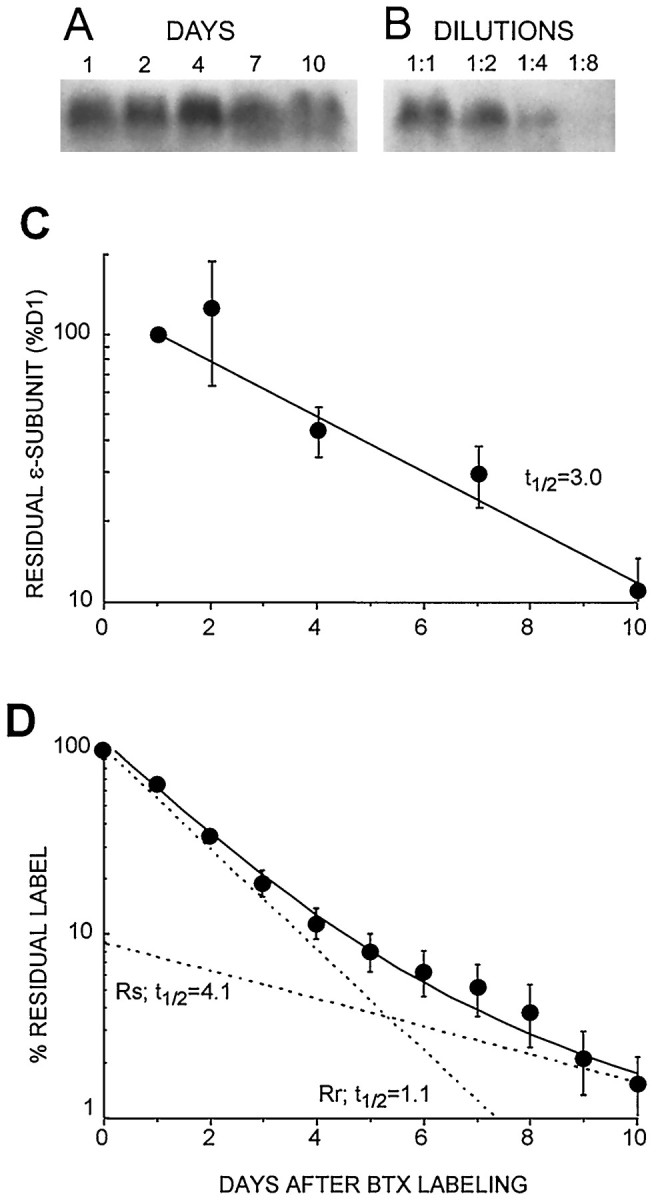
Western blot analysis of ε-AChR degradation in cultured muscle cells compared with total AChR degradation measured by125I-BTX release. A, Sample of Western blots at different times after BTX labeling, showing the ∼60 kDa immunogenic band recognized by the anti-ε subunit antibody 52Abε (as in Fig. 2). B, Successive dilutions of antigen established linearity of the Western blot response. C, A plot of the density of the anti-ε subunit bands, decreasing with time after labeling, gives a single exponential decay with a half-life of ∼3.0 d (n = 3 experiments), similar to the slow components in Figure 3, A and B. No fast component is seen. D, Residual label from parallel plates assayed by 125I-BTX release gives a double-exponential fit for total AChR (as in Fig. 3A,B), revealing two AChR populations with slow, Rs, and fast, Rr, components having t½ values of 4.1 and 1.1 d, respectively.