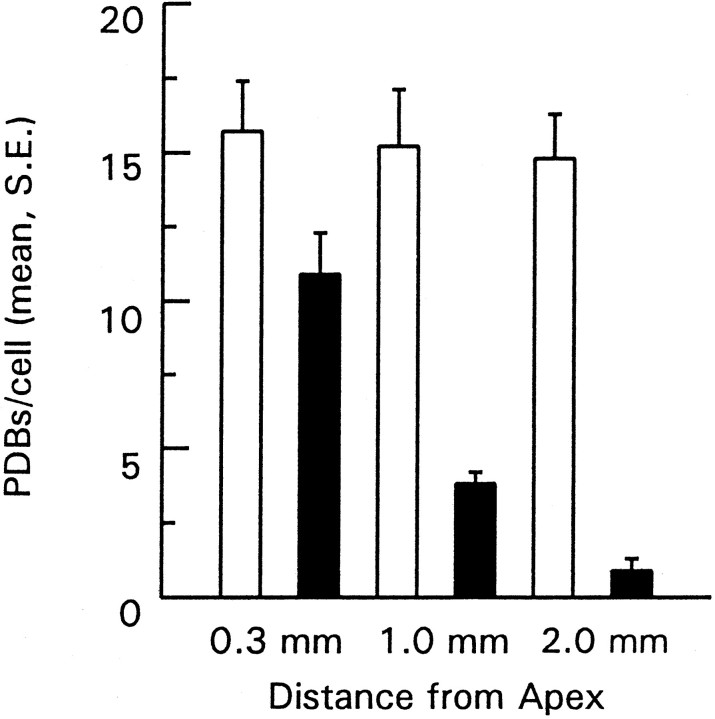
Fig. 4.
Average number of PDBs in neural and abneural cells in three regions of the cochlea. Total reconstructions performed for 12, 12, 9, 5, 10, and 8 cells in each group (proceeding fromleft to right across figure). Mean values (± SE) from cells in the neural-most 30% of the cross section represented byopen bars; cells from the abneural-most 30% represented by filled bars. All means were significantly different (p < 0.05; Student’s ttest) except for comparisons among neural cells.

