
Fig. 4.
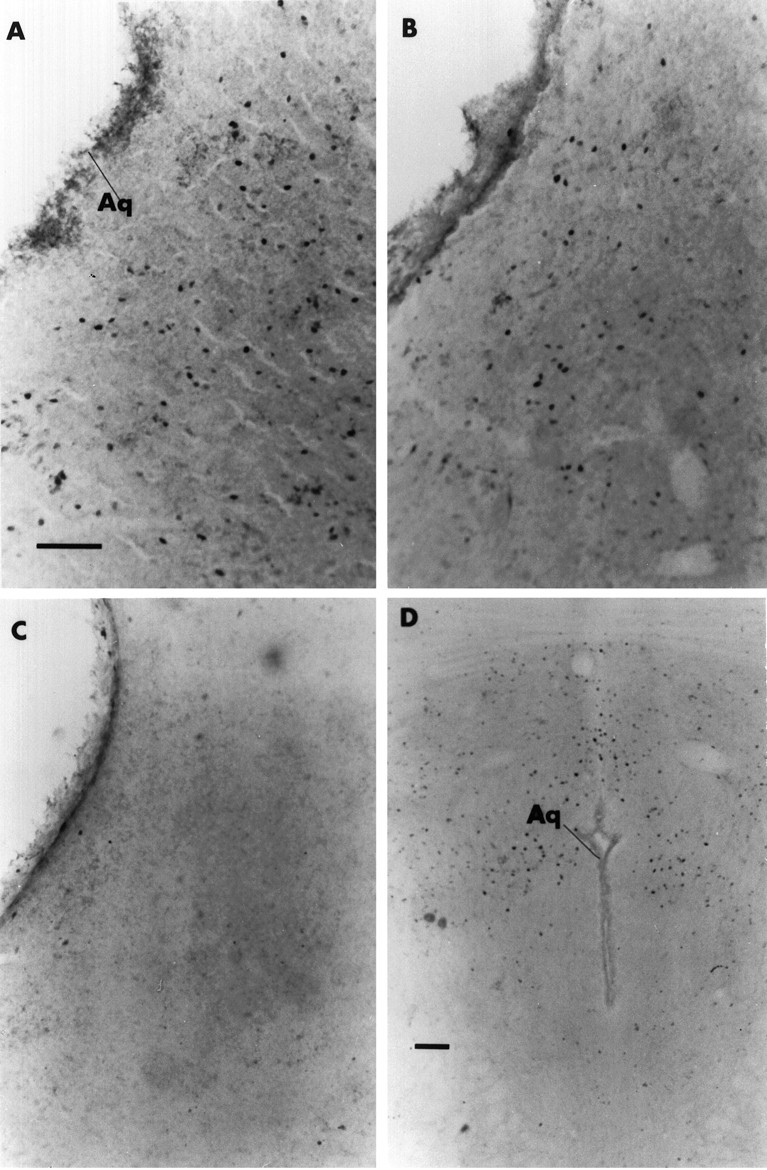
Photomicrographs of cPAG in a representative dam in each of three groups: A, SK; B, NSK;C, no stimulus. D, Photomicrograph of rPAG in a representative NSK dam, where Fos is concentrated in the dorsal and dorsolateral regions. Scale bar, 100 μm.