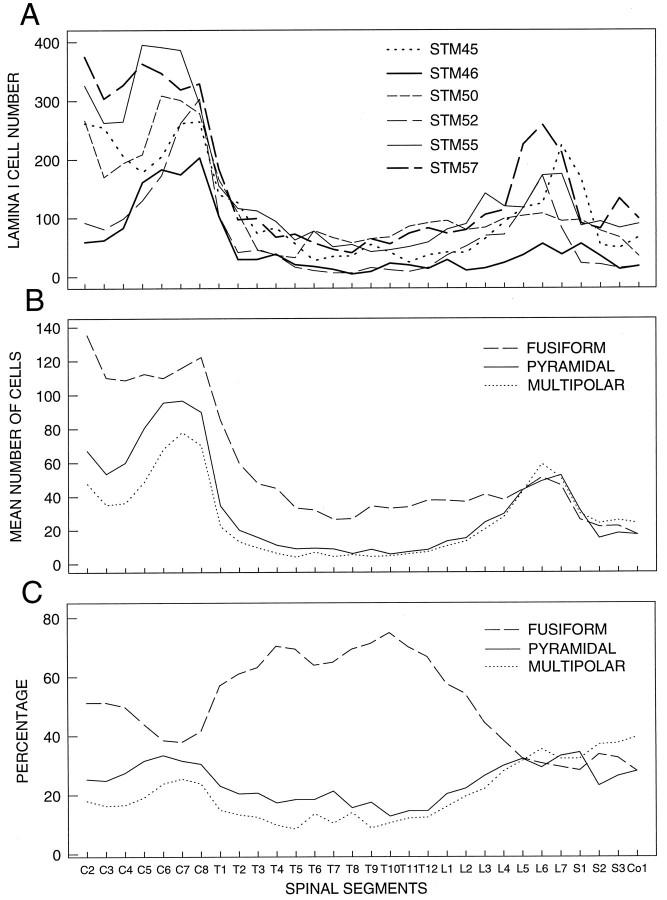
Fig. 7.
A graphic display showing the longitudinal (segmental) distribution of labeled lamina I STT cells over the length of the spinal cord (second cervical through first coccygeal segments). A, The distribution of the raw number of labeled lamina I STT cells in each of the six cases. Peak concentrations occurred at C2 and in the cervical and lumbosacral enlargements. Case STM46 (owl monkey, small injection, and short survival time) had a low number of cells and did not show peaks at C2 and the lumbar enlargement. B, The distribution of the mean number of each of the three types of lamina I STT cells in five cynomolgus monkeys (see Table 3). The number of fusiform cells was higher overall, but in the lumbosacral enlargement the three type of cells were almost equal in number. C, The distribution of the relative proportions of each of the three types of lamina I STT cells (see Table3). The proportions of P and M cells increased in the enlargements relative to the proportion of fusiform cells.

