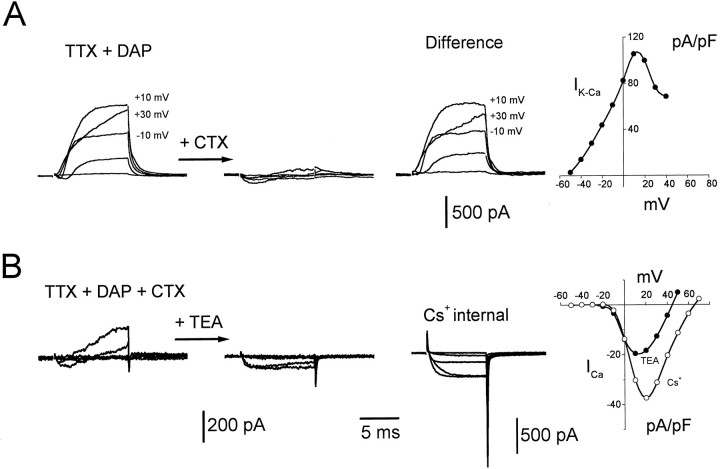
Fig. 3.
Isolation of the minority presynaptic ionic currents. Representative currents evoked by depolarizing steps of voltage from a holding potential of −70 mV to −50, −30, −10, +10, and +30 mV are shown. A, Presynaptic currents inTTX + DAP (left set of traces) and after (middle set) the addition of 100 nmcharybdotoxin (CTX). The right set of traces was obtained by subtraction of the middle set of traces from the left set. Voltage values given next to the current traces indicate that the CTX-sensitive outward current was depressed at higher voltages.Right, I–V plot generated from the difference traces for values 8 msec into the step. Currents were normalized to the cell capacitance. Similar results were seen in 10 other experiments. B, Left, Presynaptic currents in TTX + DAP + CTX. Middle set of traces, After addition of 20 mmtetraethylammonium Cl− (TEA). The right set of traces was obtained from a different cell after replacement of the internal K+ with Cs+ (Cs+internal) and an increase of the external Ca2+to 10 mm. Right, Plots of maximum Ca current versus voltage obtained from the middle set of traces (TEA, filled symbols) and the right set of traces (Cs+, open symbols). Currents were normalized to the cell capacitance. Similar results were seen in three other preparations (TEA) and in 12 other preparations (Cs+ internal). A andB were taken from different varicosities. Internal solution B was used, except for the panel labeled Cs+internal where internal solution C was used.

