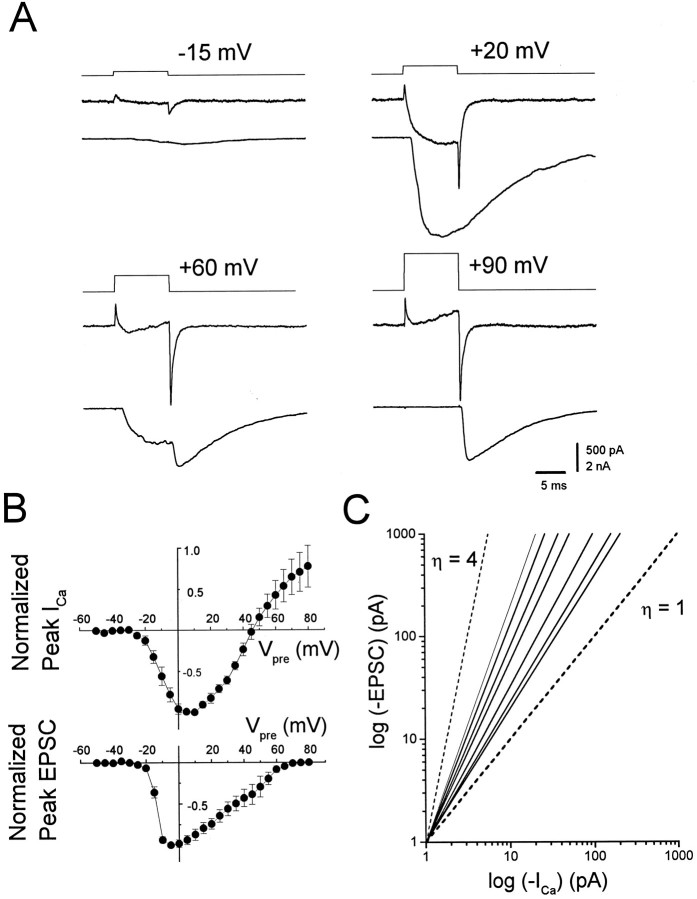
Fig. 4.
Current–voltage relationships of presynaptic Ca current and EPSCs. A, Representative experimental results showing depolarizing steps of voltage from a holding potential of −70 mV to specified voltages (top traces) evoking Ca currents (middle traces) linked to transmitter release transmitter release (EPSCs, bottom traces). A depolarizing step to +20 mV evoked a larger Ca current and a correspondingly larger EPSP than a step to −15 mV. At +60 mV the Ca current was suppressed during the step, resulting in less release. An off-response was apparent that corresponded to the large Ca tail current. At +90 mV, the Ca current and release were suppressed, but a large off-response was seen in response to the tail current.B, Current–voltage plots for seven synapses normalized to the maximum current value seen for each synapse plotted as a function of the presynaptic potential. Top graph, Peak presynaptic Ca current; bottom graph, peak postsynaptic current. Error bars in this and all figures represent SD. Internal solution C was used for all experiments. The external solution was NFR containing 300 nm TTX and 1 mm DAP.C, Double log plots of the presynaptic current measured at 9 msec into the step versus peak postsynaptic current. Thesolid lines are least-squares fits of the data from the same seven synapses illustrated in Figure 4B, using only the currents activated between −35 and −5 mV (see text). The range of slopes obtained for these cells was 1.30 to 2.29. For comparison, first-power (η = 1) and fourth-power (η = 4) functions have been plotted as dashed lines.

