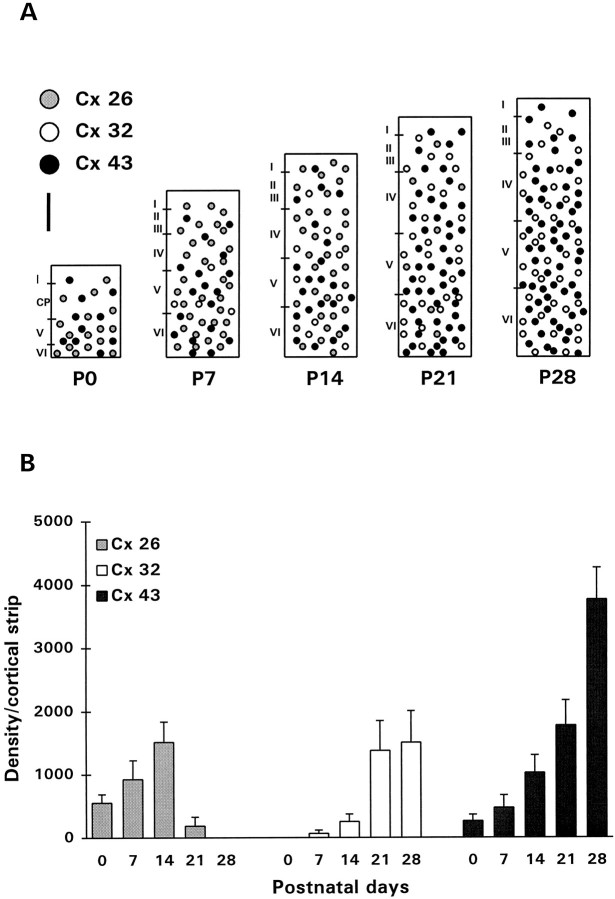
Fig. 7.
Expression of Cxs in the rat cerebral cortex during postnatal development. A, Schematic representation of the pattern of distribution of Cxs 26, 32, and 43 in the visual cortex between birth and P28. Scale bar, 200 μm.B, Average levels of Cxs 26, 32, and 43 immunoreactivities measured from sections of visual cortex of five rats at each of the ages shown. The levels were corrected according to Bayer and Altman (1991) to take into account the expansion of the cortex during postnatal development. Error bars represent SEM.

