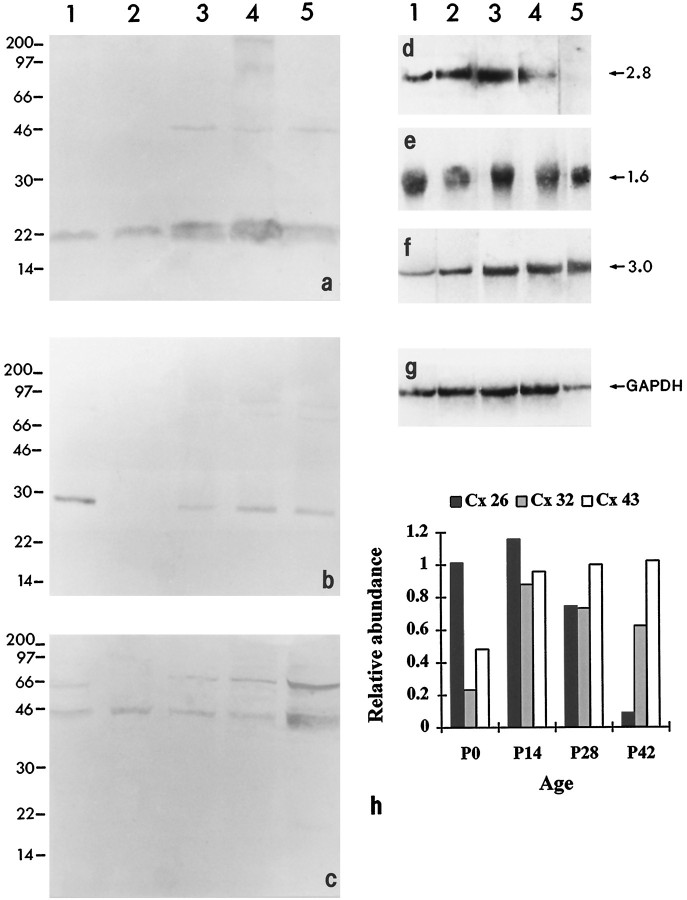
Fig. 9.
Localization of Cxs in Western and Northern blots of control (liver or heart) and cortical tissues. Western blots of samples labeled for Cxs 26 (a), 32 (b), and 43 (c); lane 1 corresponds to samples of control tissues (liver, Cxs 26 and 32; heart, Cx 43), and lanes2–5 correspond to samples of visual cortex of rats at P0, P7, P14, and P21. a, Cx 26 antibody detected bands corresponding to Mr 22 k protein in liver and visual cortex of P0, P7, P14, and P21 rats, with occasional faint labeling of bands at higher molecular weights. Note the increase in the intensity of signal between P0 and P14 (lanes2–4). b, Cx 32 antibody detected bands corresponding to Mr 27 k in liver and visual cortex of P7, P14, and P21 animals. Note the absence of signal at P0 (lane 2). c, Cx 43 antibody detected a prominent band at Mr43 k in heart and brain samples, in addition to a band atMr 66 k, as reported by Beyer et al. (1989). The position of the molecular mass markers is given on the left.d–g, Northern blots of samples labeled for Cxs 26, 32, and 43, and GAPDH transcripts; lane 1 corresponds to control tissues (liver or heart), and lanes 2–5correspond to samples of visual cortex of rats at P0, P14, P28, and P42. d, Cx 26 antisense RNA probes detected a band corresponding to 2.8 kb in liver and brain samples. Note the abundance of Cx 26 mRNA between P0 and P14. e, Cx 32 riboprobes detected a band corresponding to 1.6 kb in liver and brain samples.f, Cx 43 antisense probes detected a 3 kb band in heart and brain samples. g, GAPDH standard. h, Histogram illustrating the differential expression and relative abundance of Cxs mRNA in the visual cortex at four stages of postnatal development.

