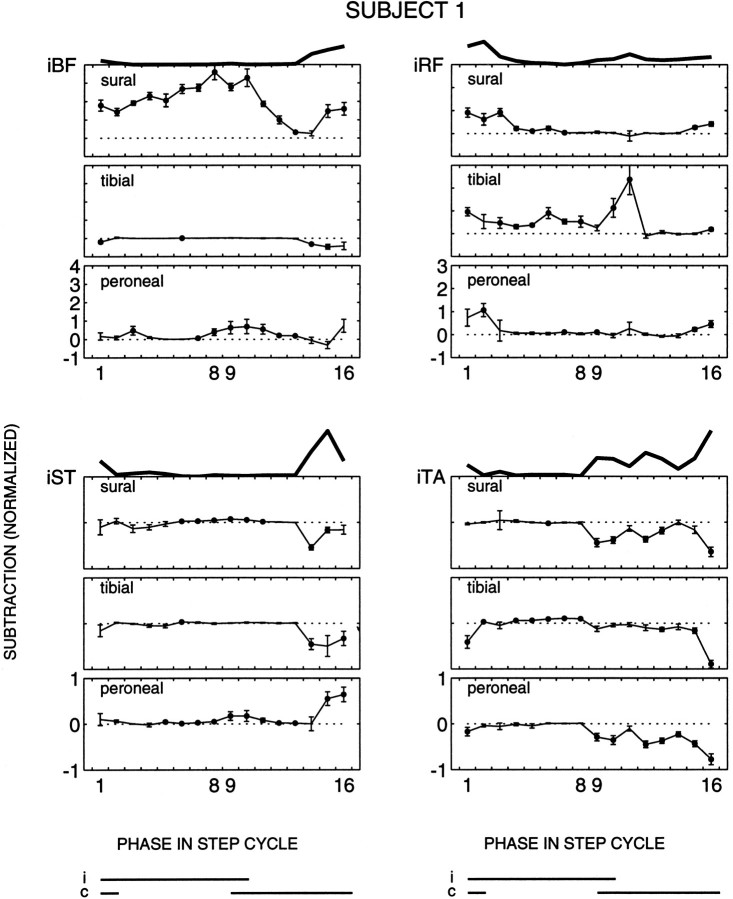
Fig. 2.
Ipsilateral muscles of subject 1. For the three nerves the subtracted responses (±SE, n = 10 trials) are plotted for all four ipsilateral muscles as a function of the phase in the step cycle. The statistical significance of the reflexes (Wilcoxon signed rank test, p < 0.05) is indicated by the black dots. Phases 1 and9 correspond to the onset of ipsilateral and contralateral stance, respectively. On the top of these figures the background activity of the corresponding muscle is shown. The data are normalized with respect to the maximum background locomotor activity of each muscle (see Materials and Methods). The ipsilateral (i) and contralateral (c) stance phases are shown at the bottom. Note the different vertical scales for the different muscles.

