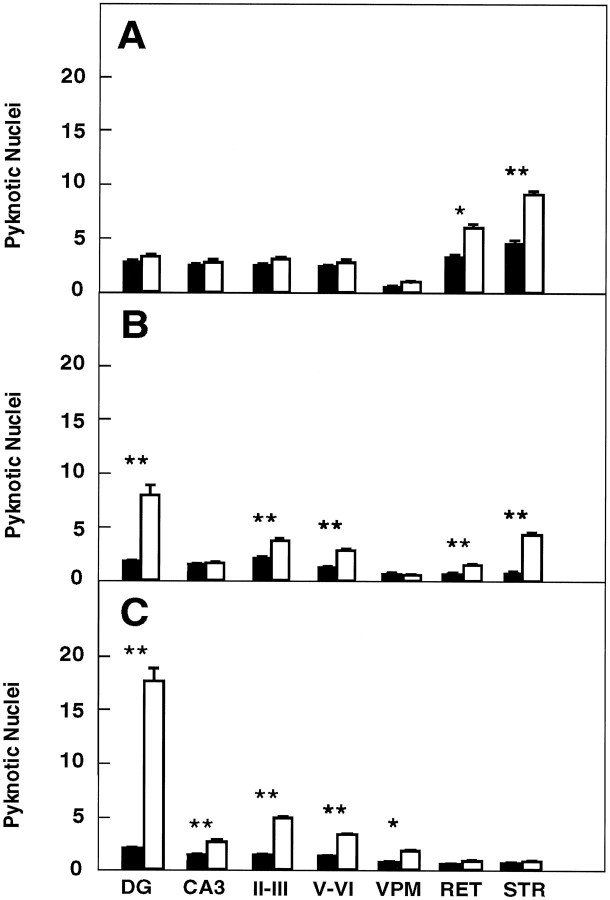
Fig. 5.
Number of pyknotic nuclei in different regions of the brain at several developmental stages (expressed as number per 100,000 μm2). A, P5–P8 mice (control mice, n = 4; trkB (−/−) mice,n = 4). B, P10–P12 mice (control mice, n = 6; trkB (−/−) mice,n = 7). C, P13–P18 mice (control mice, n = 10; trkB (−/−) mice,n = 11). Black bars, Control mice;white bars, trkB (−/−) mutant mice. DG,Dentate gyrus; CA3, CA3 hippocampal field;II–III and V–VI, cortical layers II and III and V and VI, respectively; VPM, ventroposterior medialis thalamic nucleus; RET, reticular thalamic nucleus; STR, striatum. Error bars indicate SEM;asterisks indicate that there are significant differences between control and trkB (−/−) mutant mice (*p < 0.01; **p < 0.001).

