
Fig. 7.
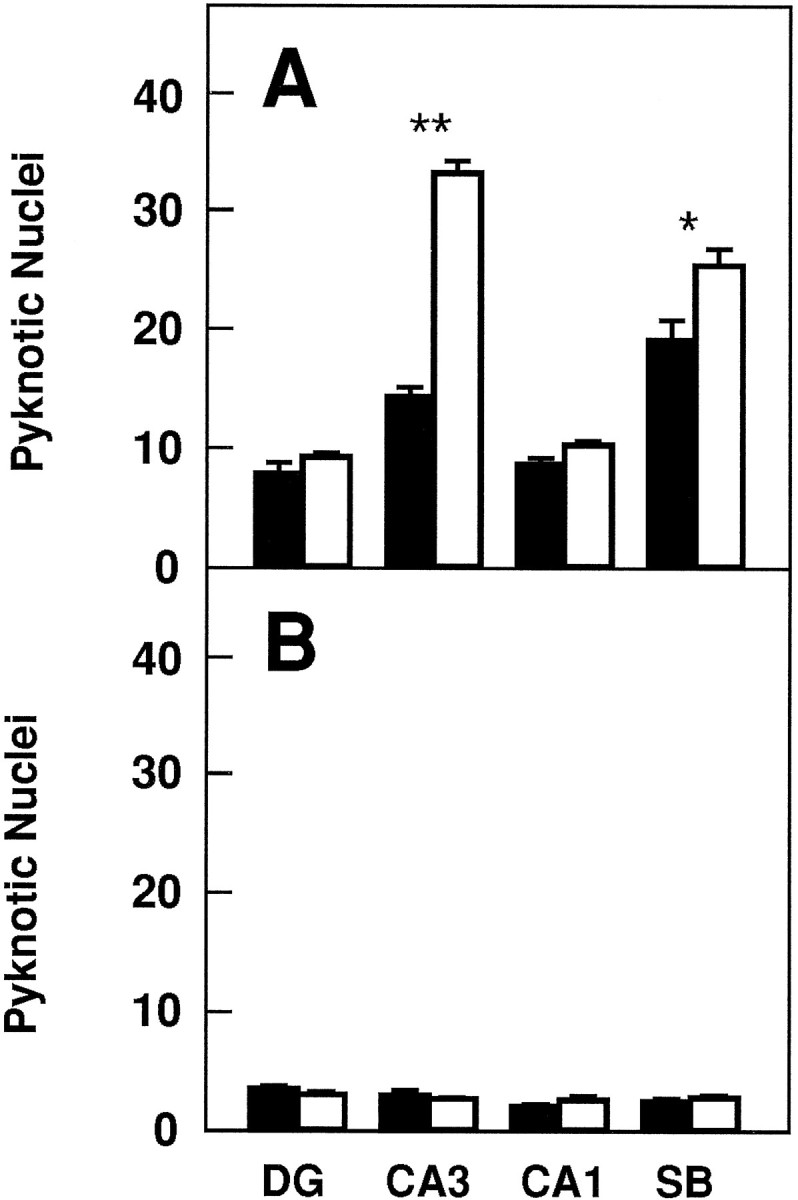
Number of pyknotic nuclei in different regions of the hippocampus after 3 (A) and 5 (B) d in culture (expressed as number per 25,000 μm2).Black bars, Control mice (n = 8 in each group of cultures); white bars, trkB (−/−) mutant mice (n = 8 in each group of cultures).DG, Dentate gyrus; CA1 andCA3, CA1 and CA3 hippocampal fields, respectively;SB, subiculum. Error bars indicate SEM;asterisks indicate that there are significant differences between control and trkB (−/−) mutant mice (*p < 0.001; **p < 0.0001).