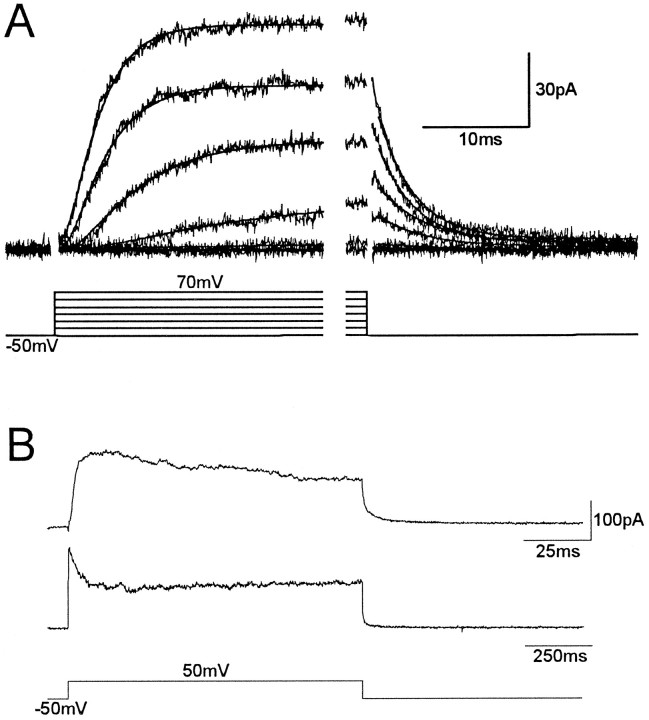
Fig. 5.
Activation and inactivation ofIK. In A, the activation ofIK (after inactivation ofIA by a prepulse to −20 mV) follows a sigmoid kinetics that is best-fitted by a double-power exponential function (superimposed in the left traces). The membrane was depolarized from a holding potential of −50 mV in 20 mV steps.Traces on the right represent tail currents from the same bouton after membrane repolarization after a 60 msec pulse, and they were well-fitted by a single exponential function with a time constant of 5–6 msec. B,IK slow inactivation during prolonged depolarization. Two current traces at two different time scales are displayed to illustrate the inactivating nature ofIK. The delayed current recorded in response to long depolarizing pulses always exhibits a similar profile with a slowly inactivating and a noninactivating component.

