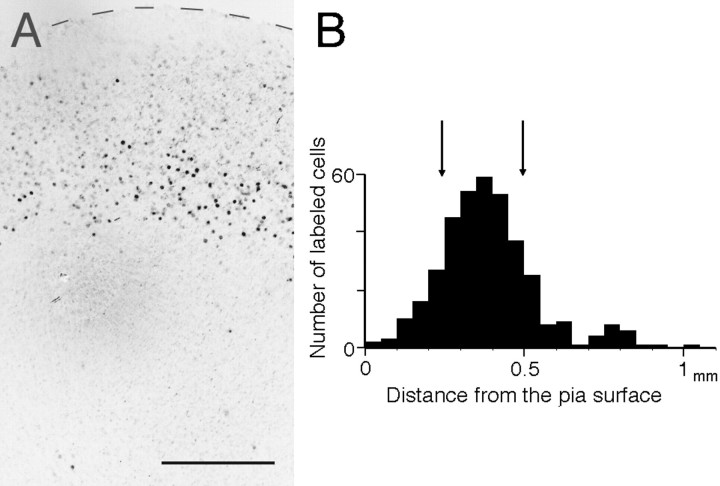
Fig. 2.
Laminar distribution of BrdU-labeled cells in the cortical explant after 1 week in vitro.A, Cortical explant where BrdU was injected at E17. Note that heavily labeled cells (black dots) are distributed in the middle layer. Contrast is inverted. A dashed lineindicates the pial surface of the cortical explant. Scale bar, 200 μm. B, Distribution histogram plotting the number of labeled cells against the distance from the pial surface for the six cocultures. Arrows indicate the laminar locations in which 70% of cells are labeled.

