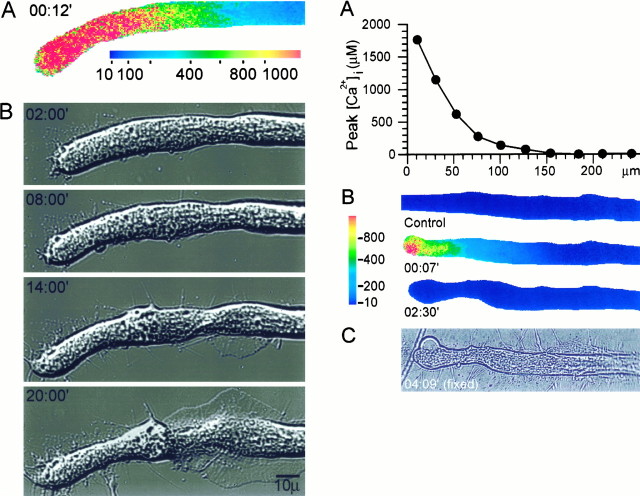
Fig. 2.
(Left) The correlation between peak [Ca2+]i after axotomy and the site of growth cone formation. A mag–fura-2 ratio image of the spatial distribution of [Ca2+]i at the time at which [Ca2+]i was elevated to its maximal levels (A) is compared with DIC images of the same neuron that show the subsequent formation of the new growth cone (B). [Ca2+]i was elevated to ∼300 μm at the site from which the lamellipodium was first observed to extend. [Ca2+]i is given in μm. Time is given in minutes from axotomy.

