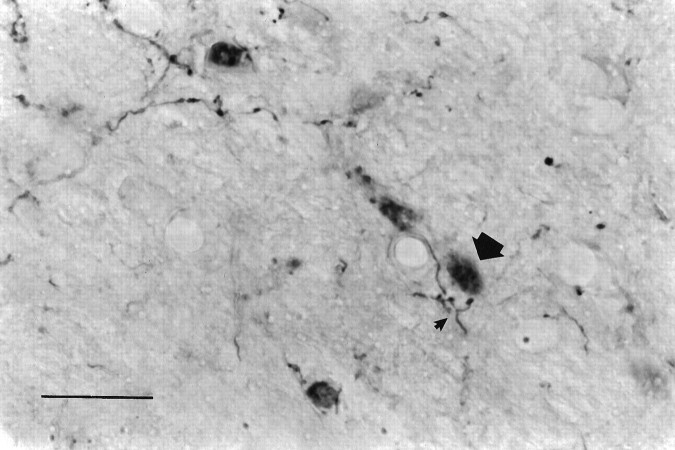
Fig. 11.
Photomicrograph depicting anterogradely labeled fibers in relation to FLI nuclei in PCRt at level 4 for the same animal in Figure 10. Note the labeled fiber showing axonal varicosities (small arrowhead) in close apposition to a FLI nucleus (large arrowhead). Top, Dorsal; left, medial. Scale bar, 25 μm.

