
Fig. 3.
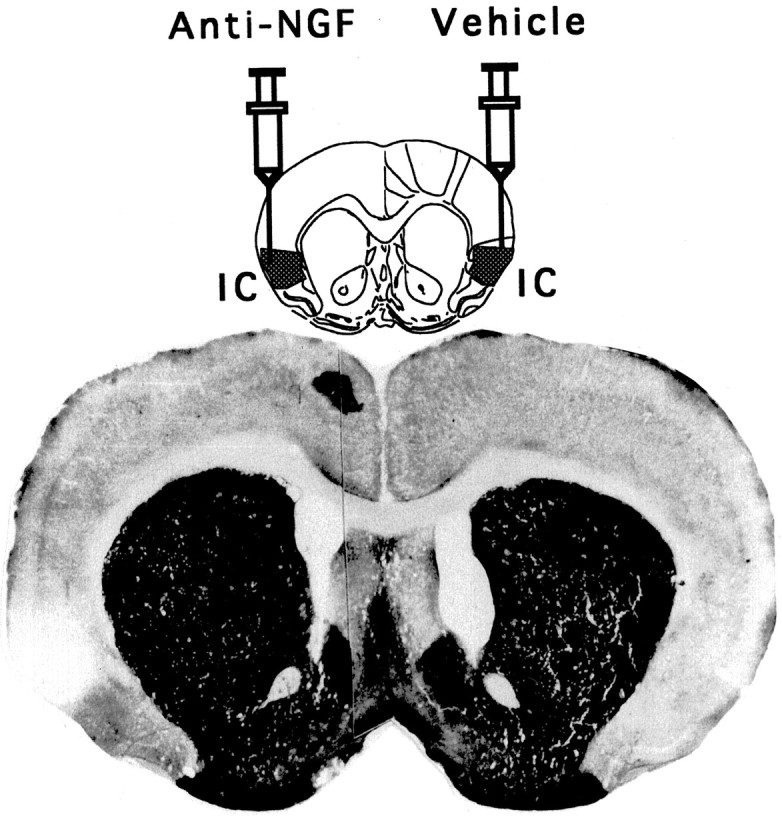
Schematic representation of repeated injections of anti-NGF mAbs into the IC, whereas the contralateral cortex received the corresponding vehicle treatment. Photomicrography of a coronal section showing the weak reaction for the AchE histochemistry in the anti-NGF-treated area (left) compared with the control side (right).